This weeks task asks me to reflect, distil and question the purpose and impact of a given piece of data represented graphically. During the introduction of this task, I was drawn to the diagram of causes of mortality and upon further investigation of the five sources suggested I was drawn to this again for a few reasons. The first thing that really struck me was that ability to distinguish the rationale and ideas displayed in the other sources. I tried to read around each subject and identify the purpose of each but I really struggled with this. I was drawn to the Accept & Proceed, Moon Landings (2016) but I felt that the Florance Nightingale had more of a story to tell and more ideas that I would find interesting to research further.
In order to appeal to peoples minds, you must first appeal to their eyes.
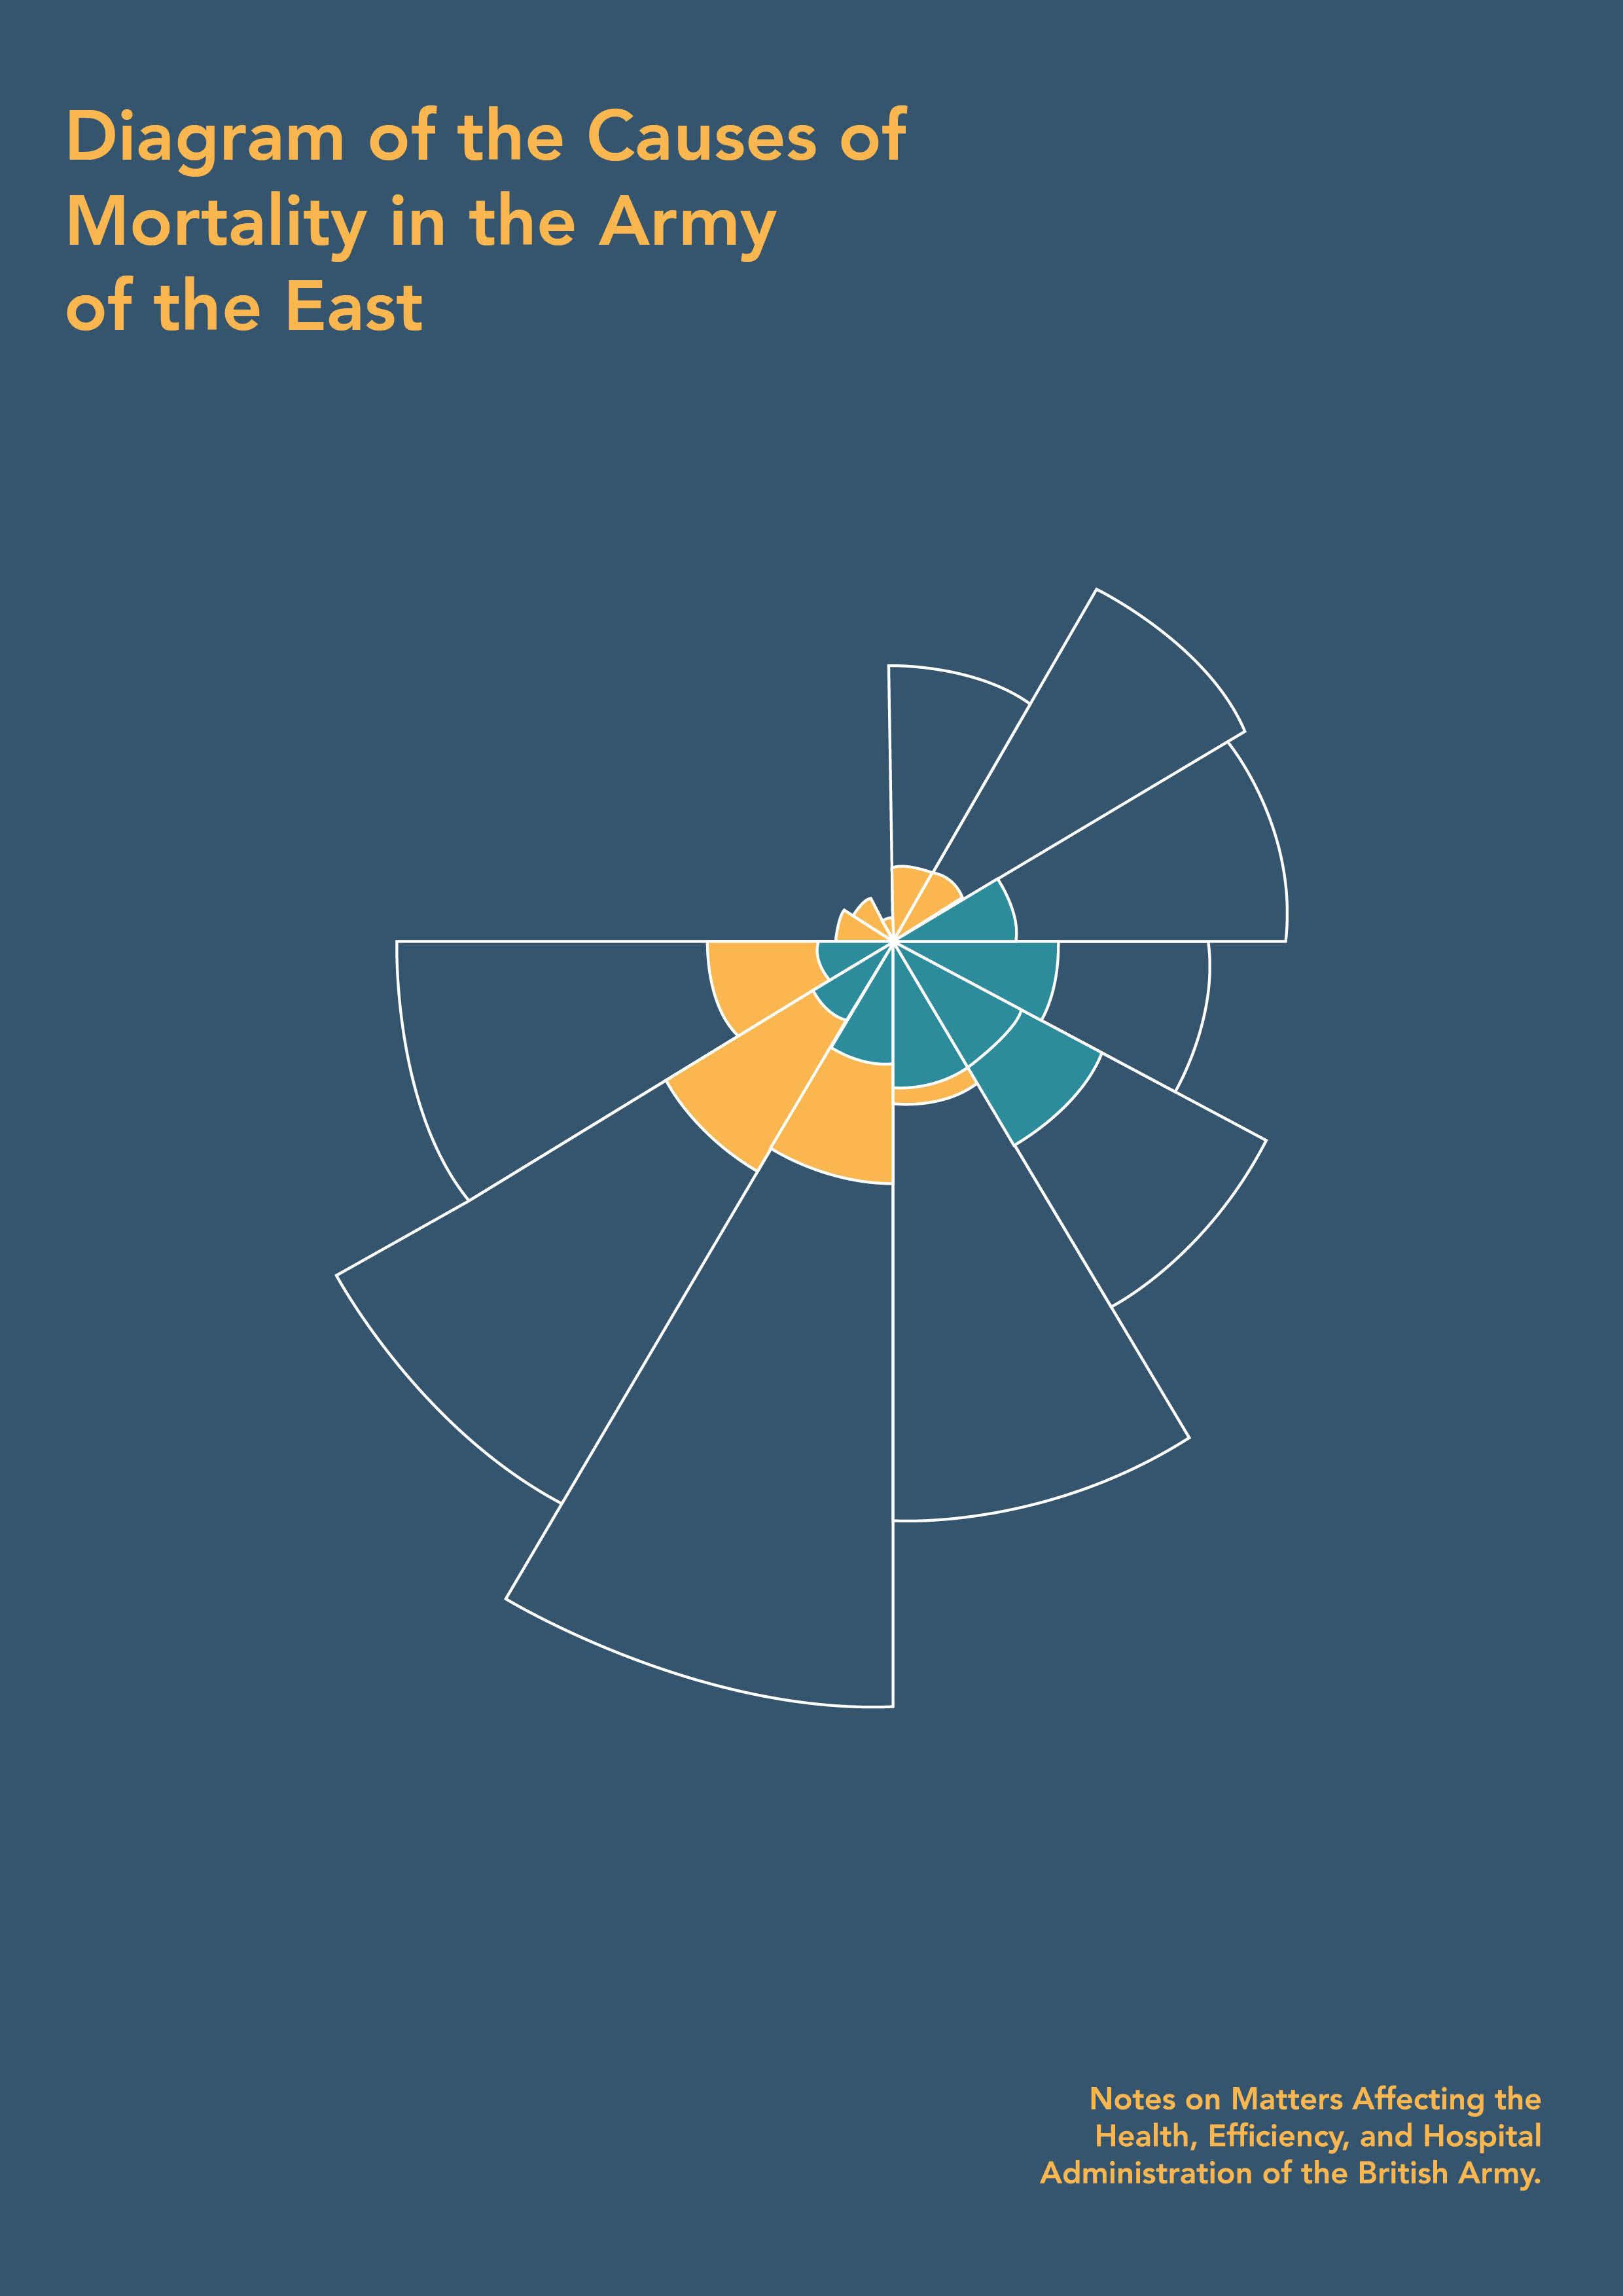
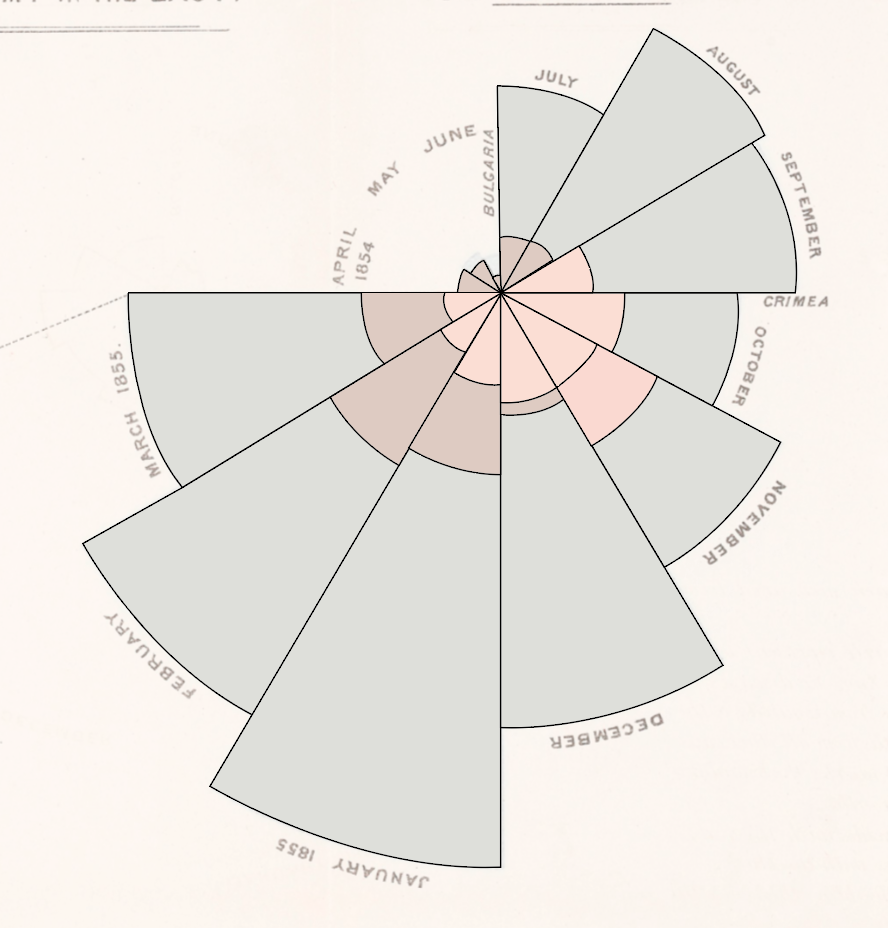
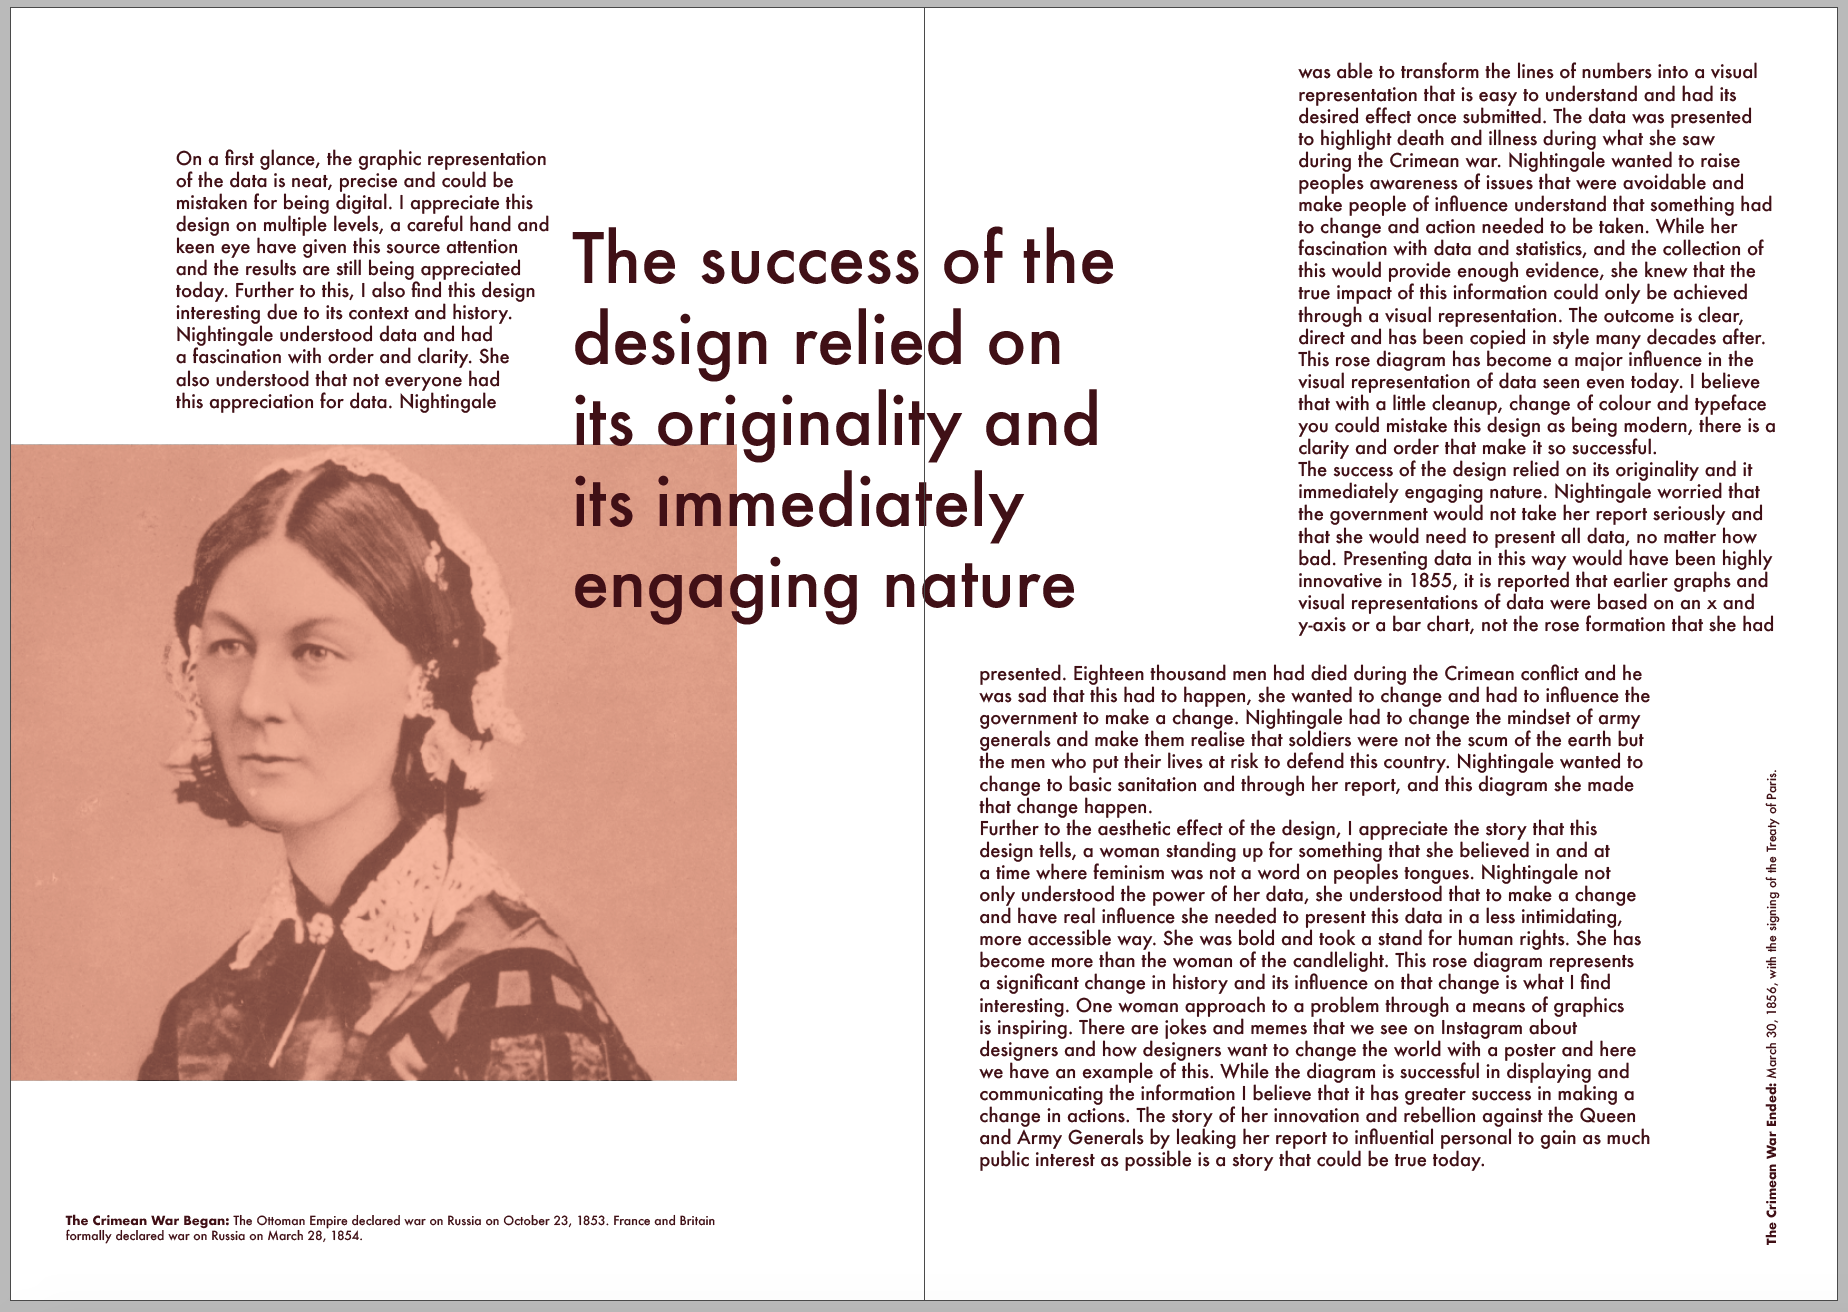
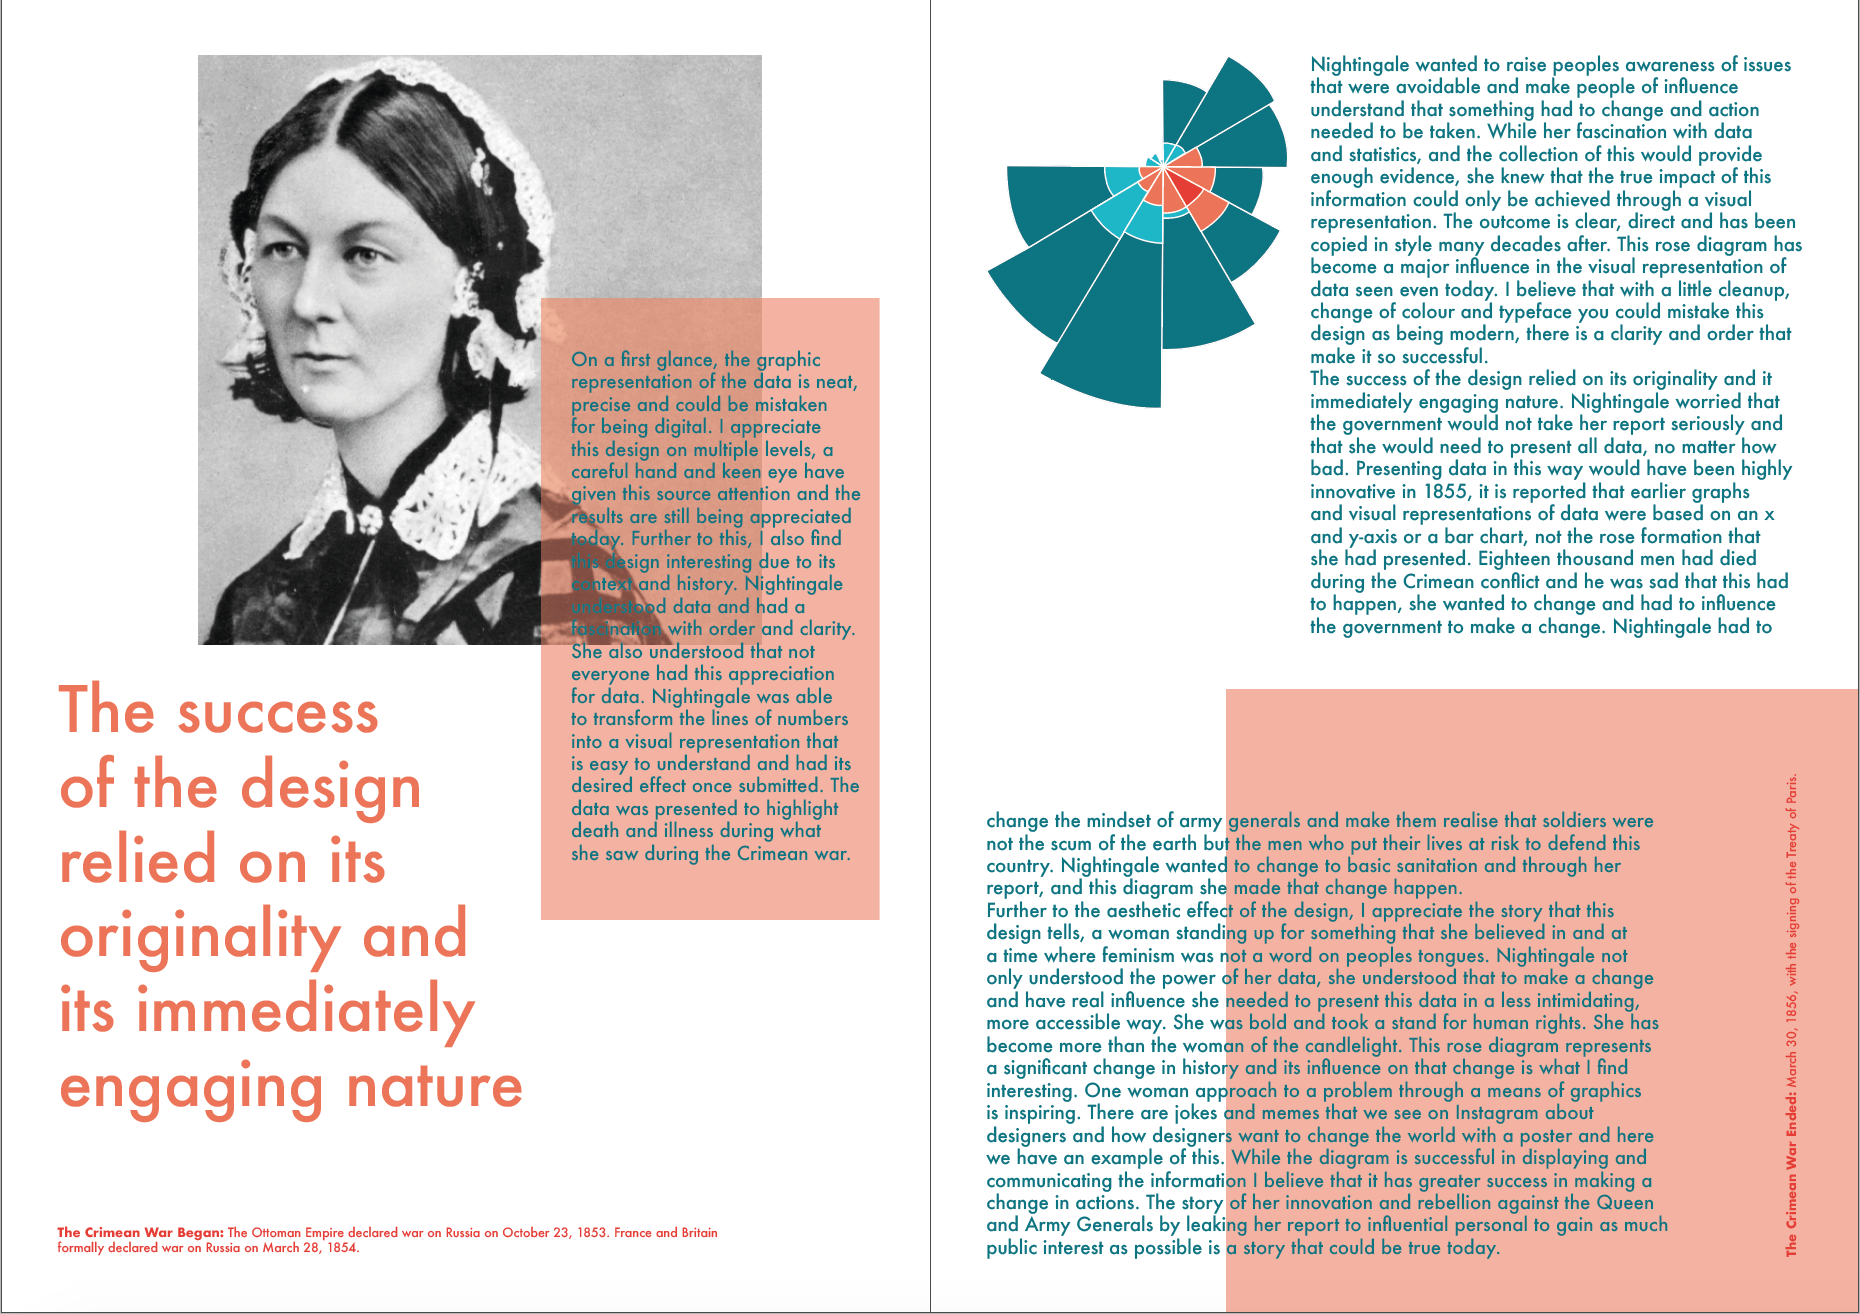
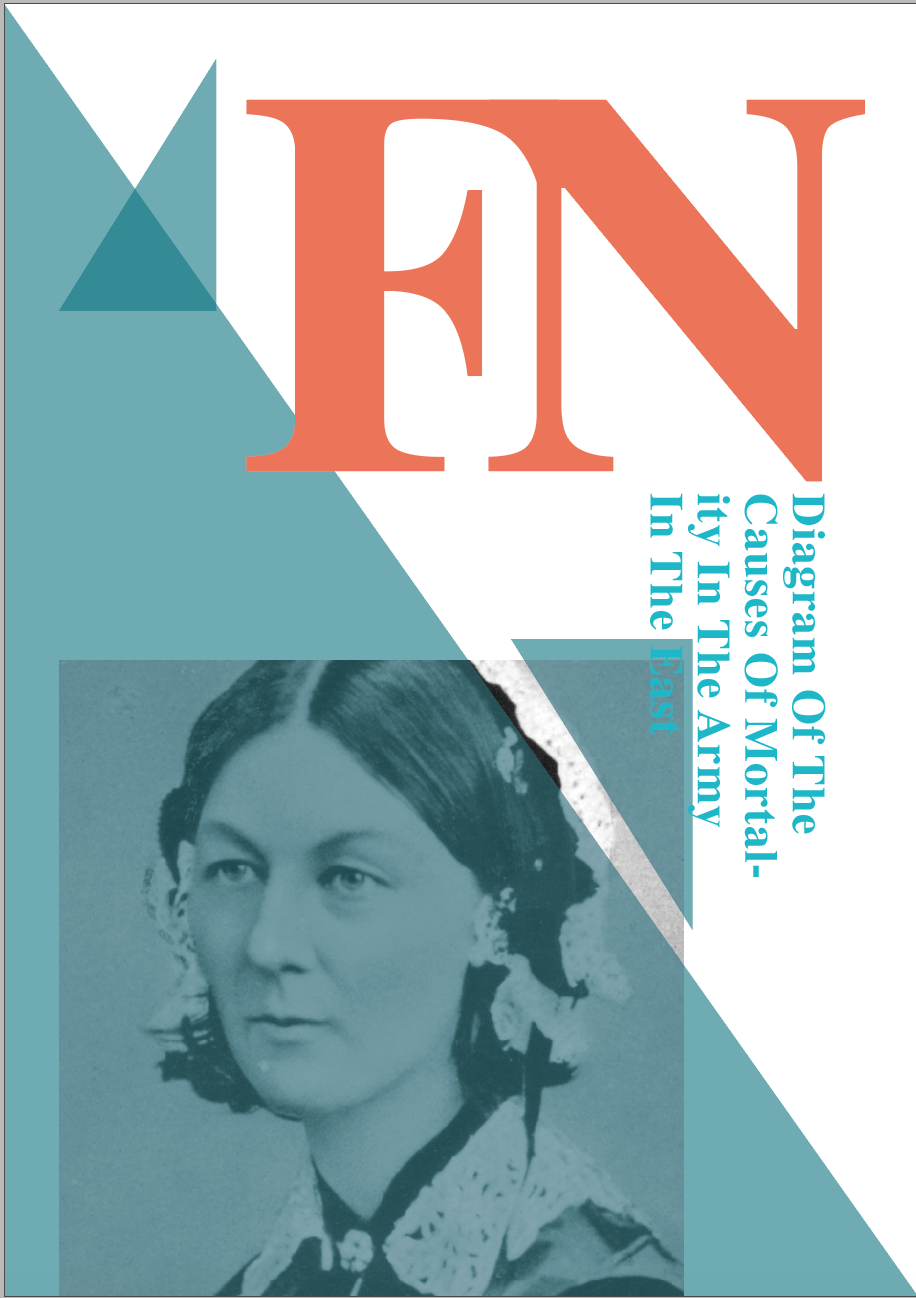
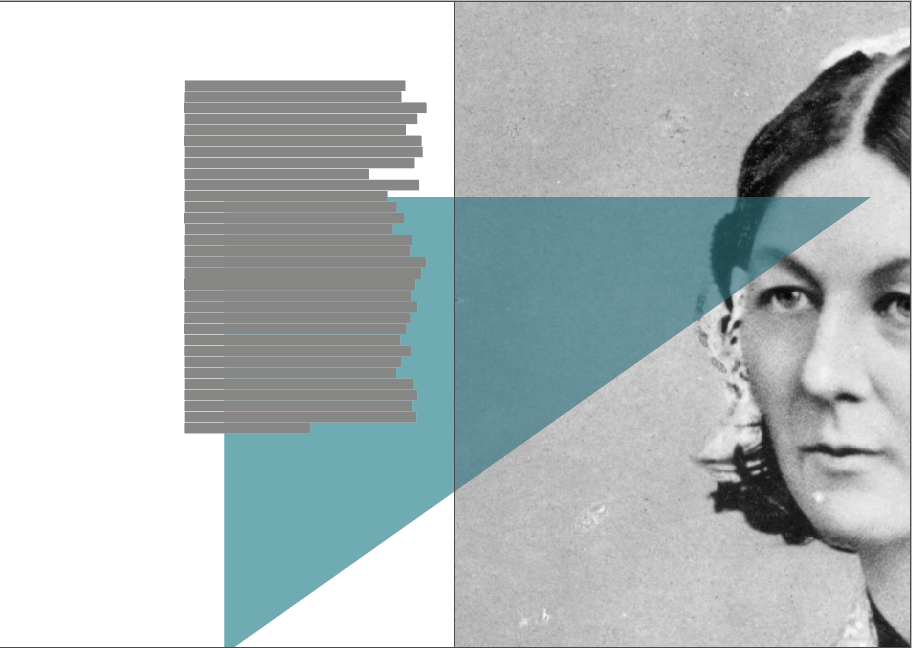
Florence Nightingale
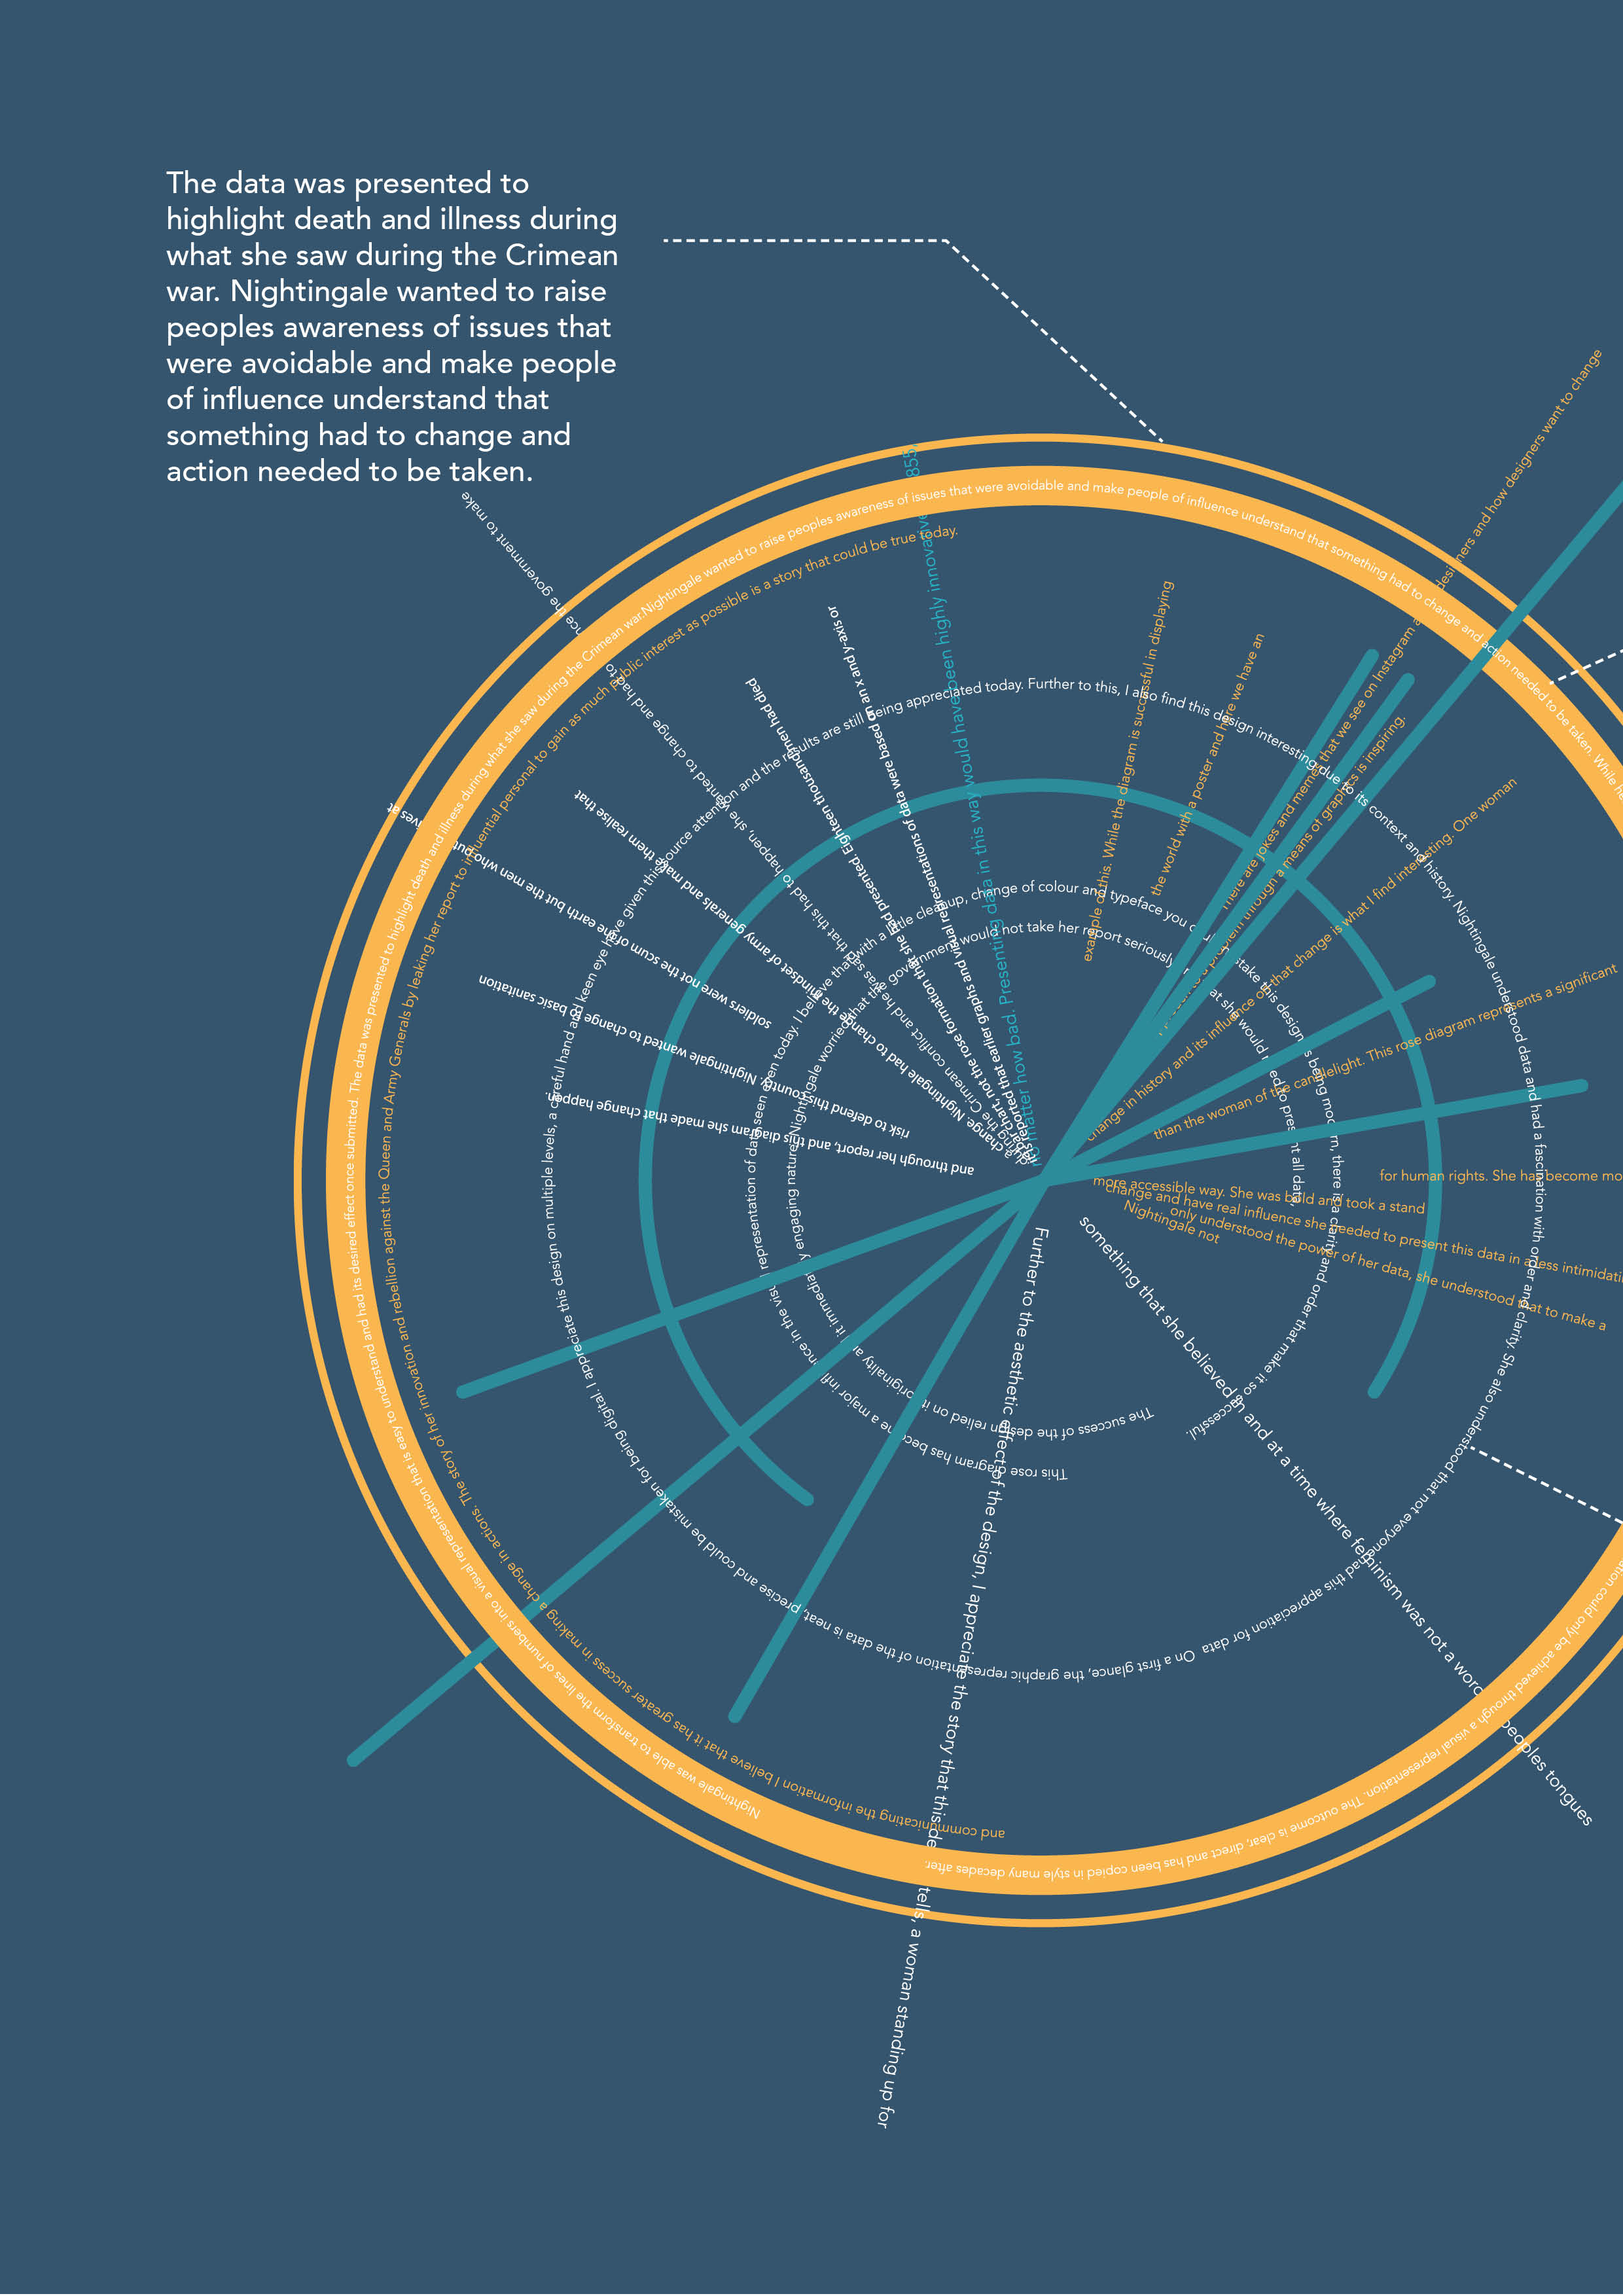
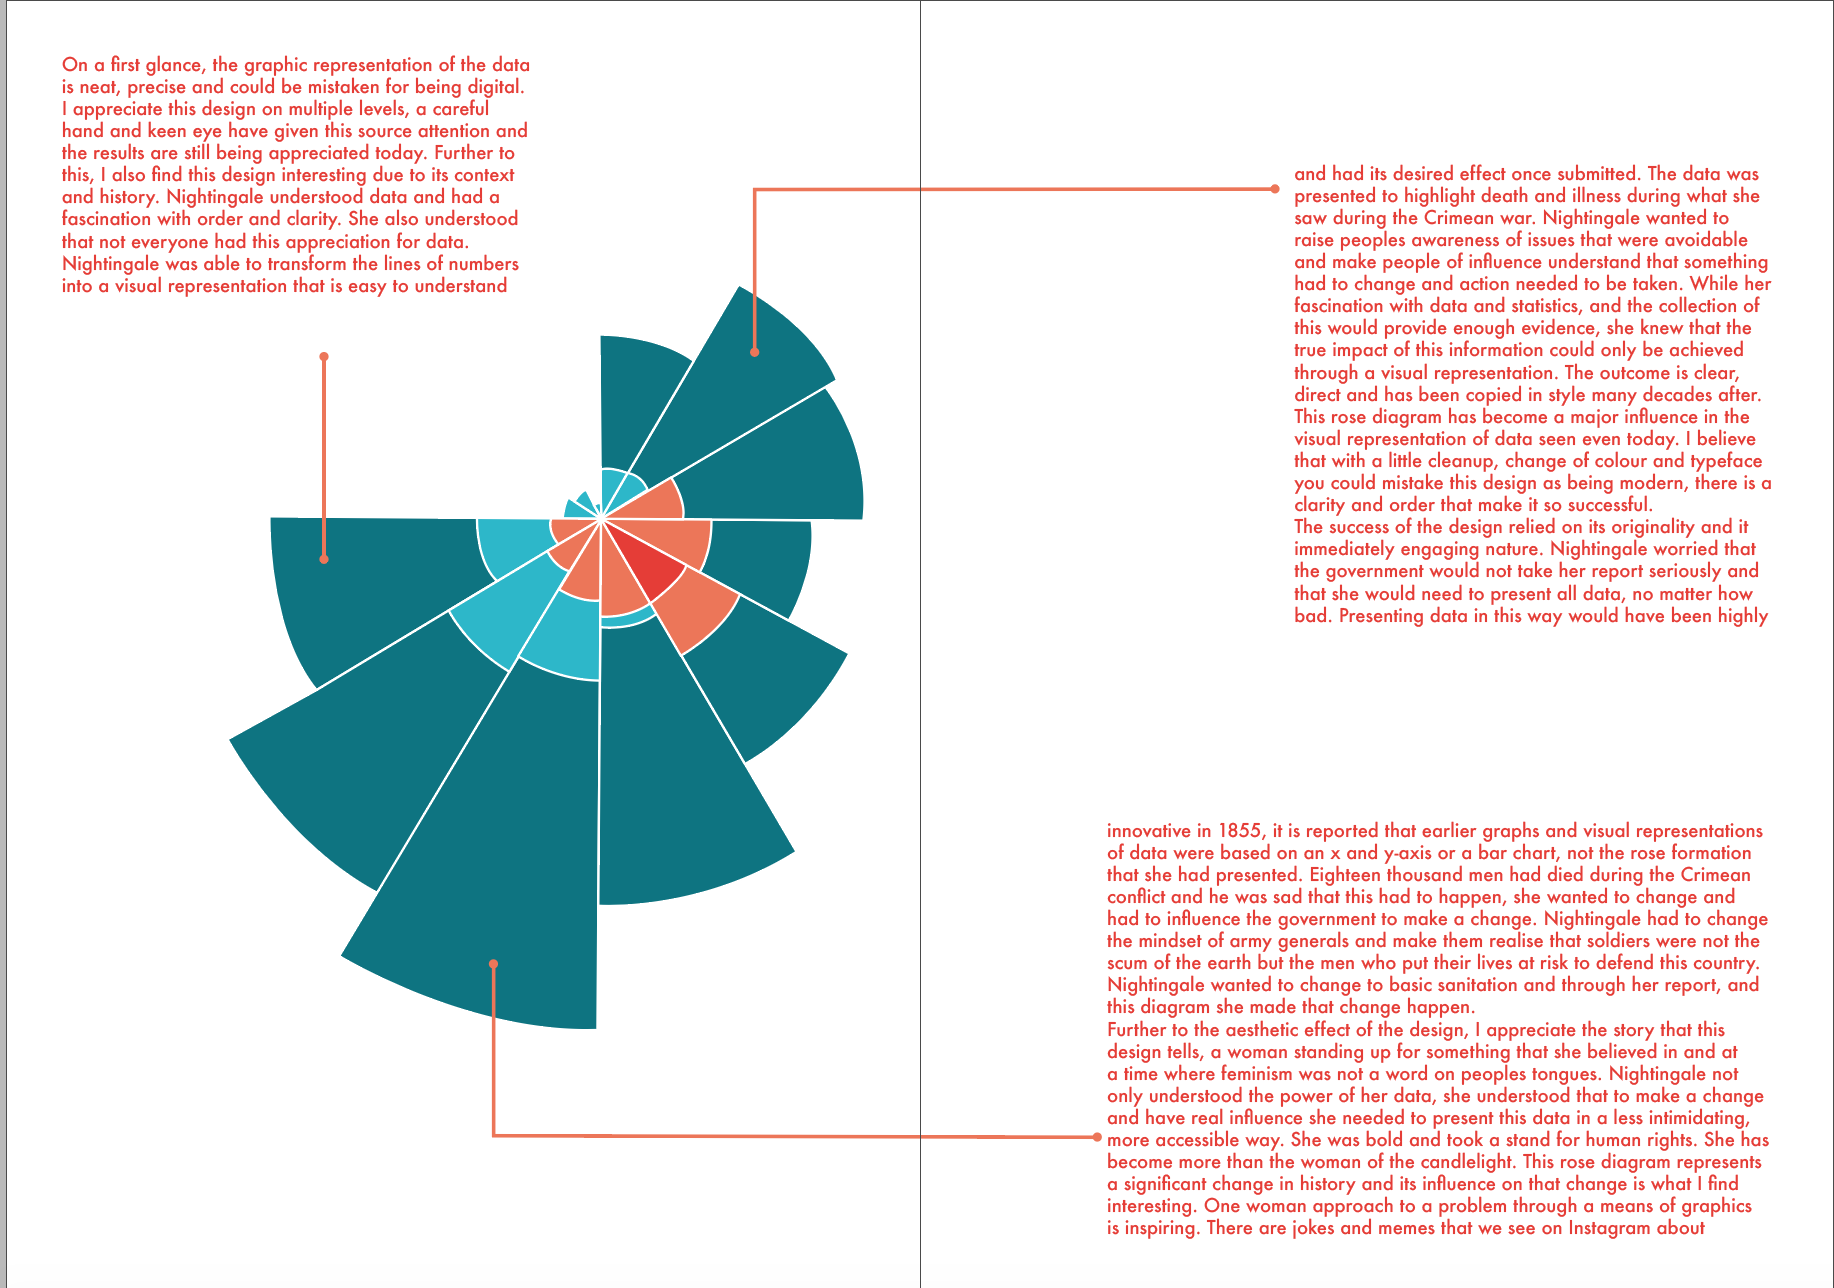
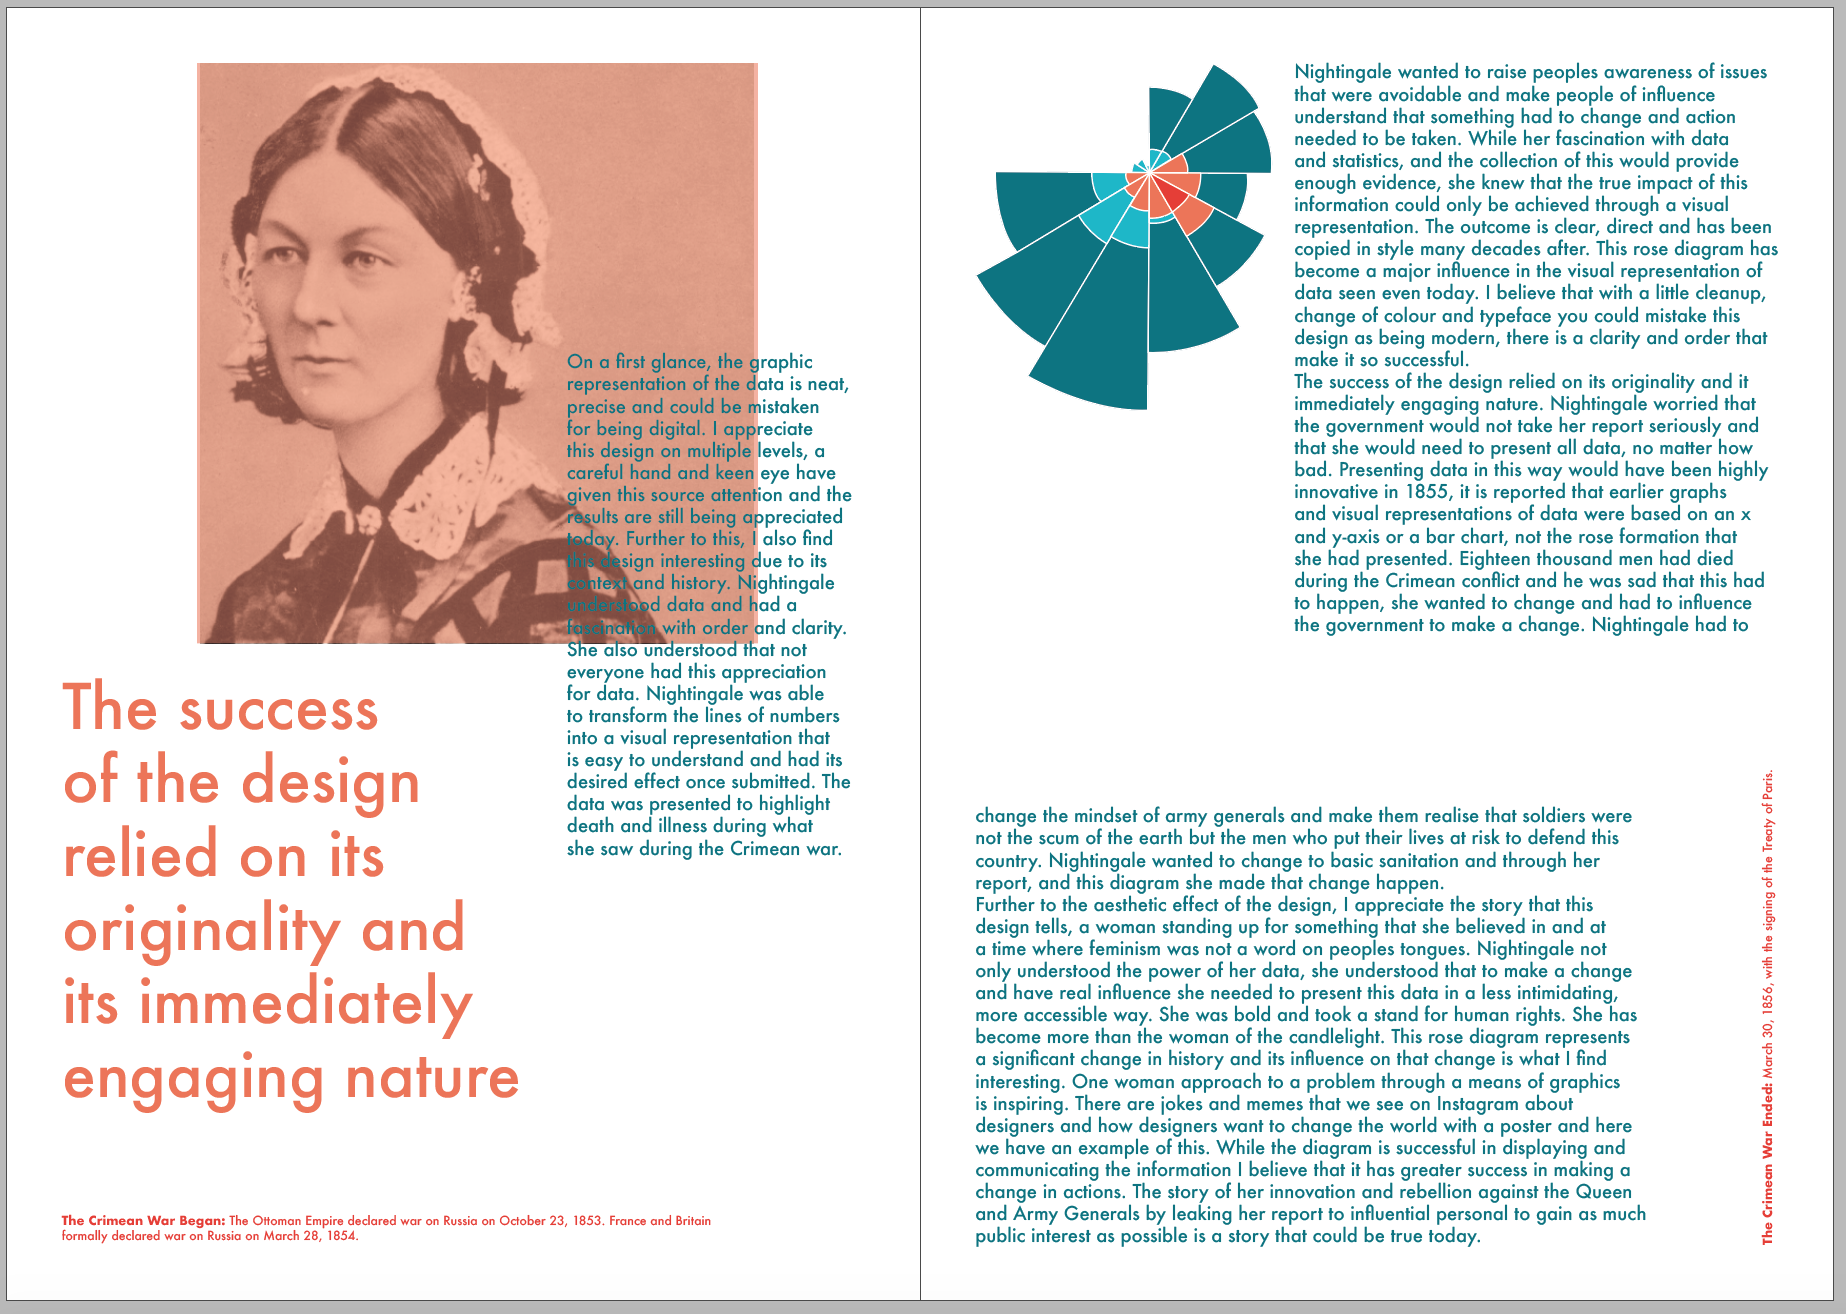
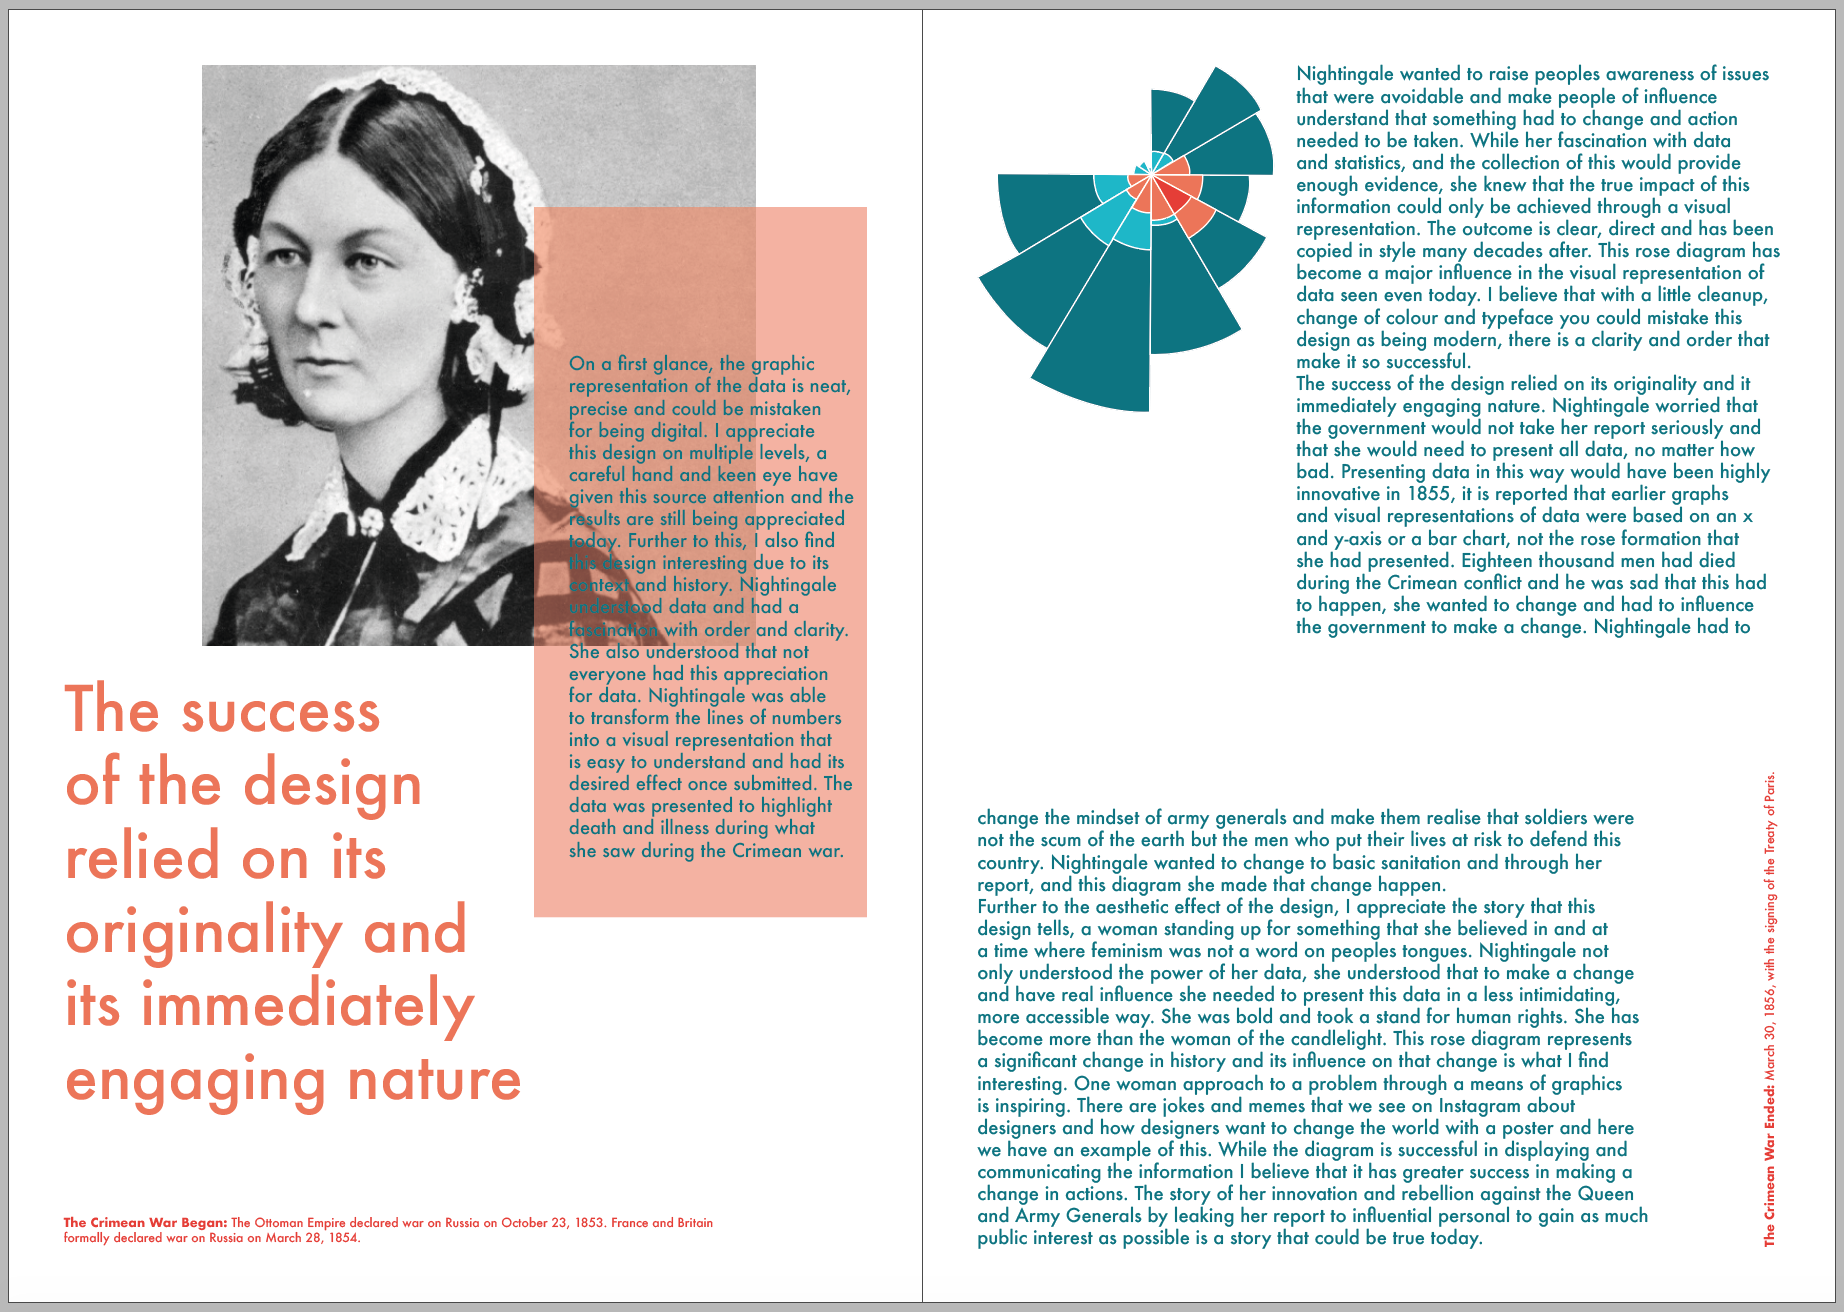
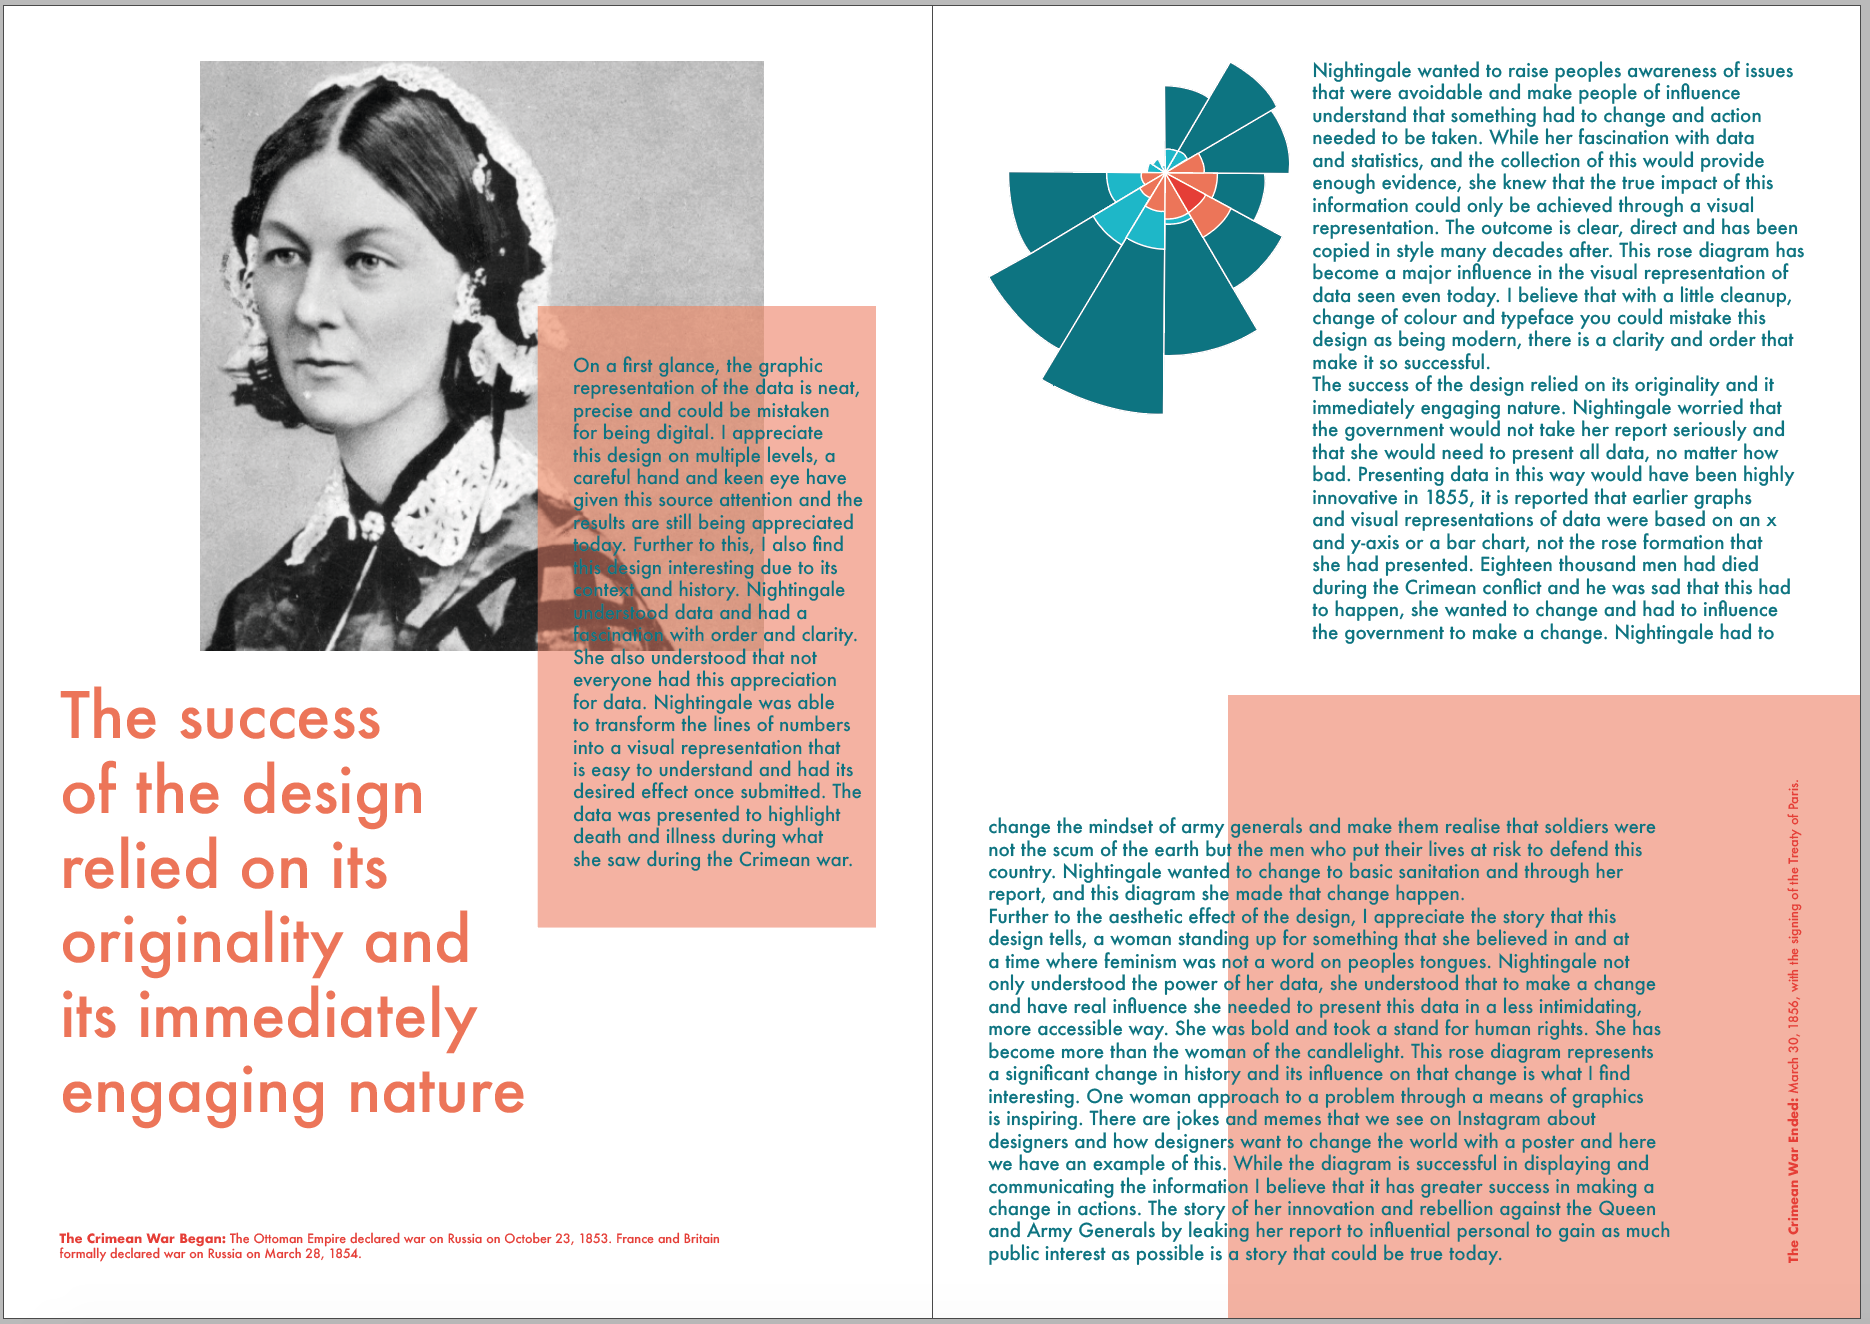
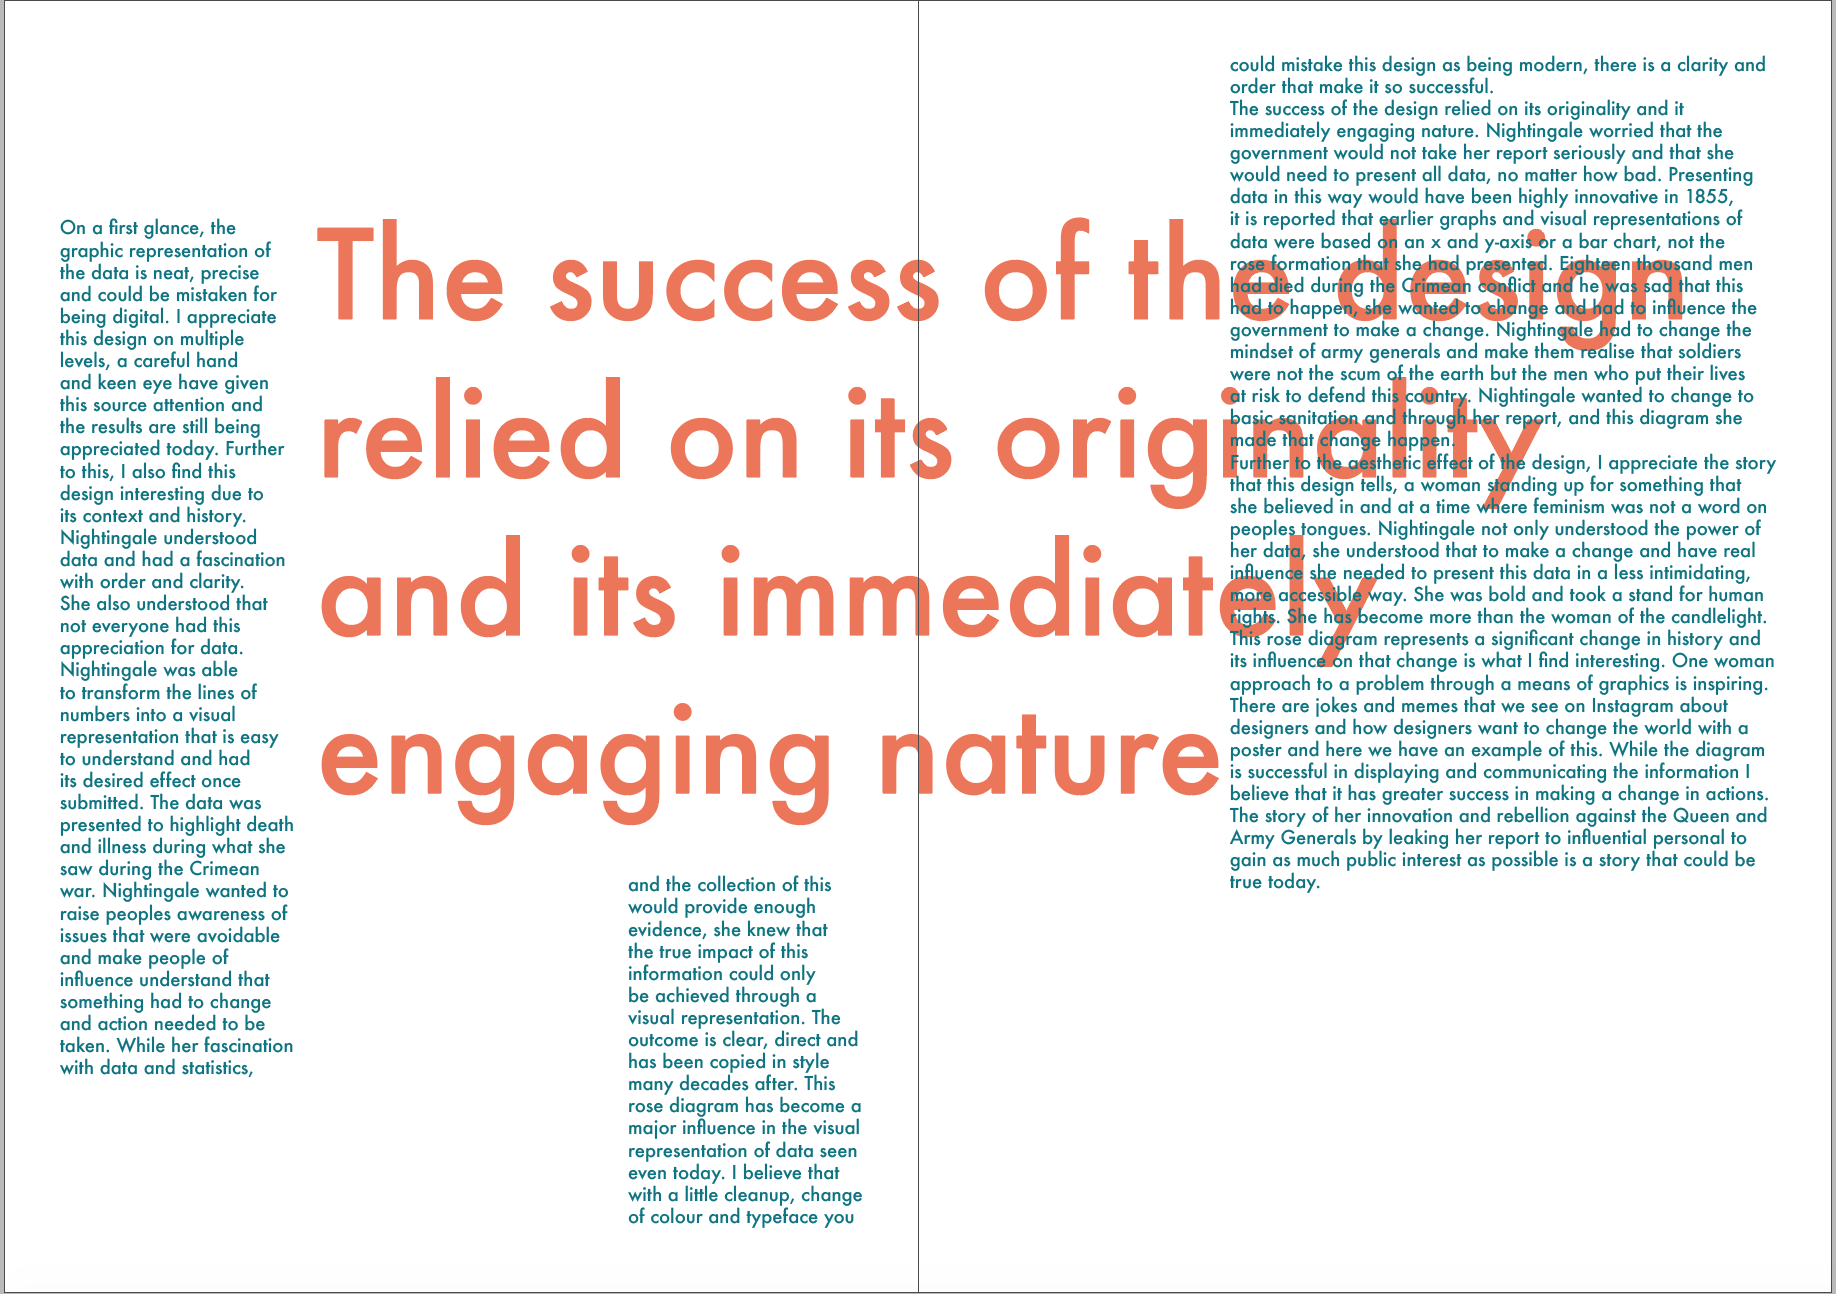
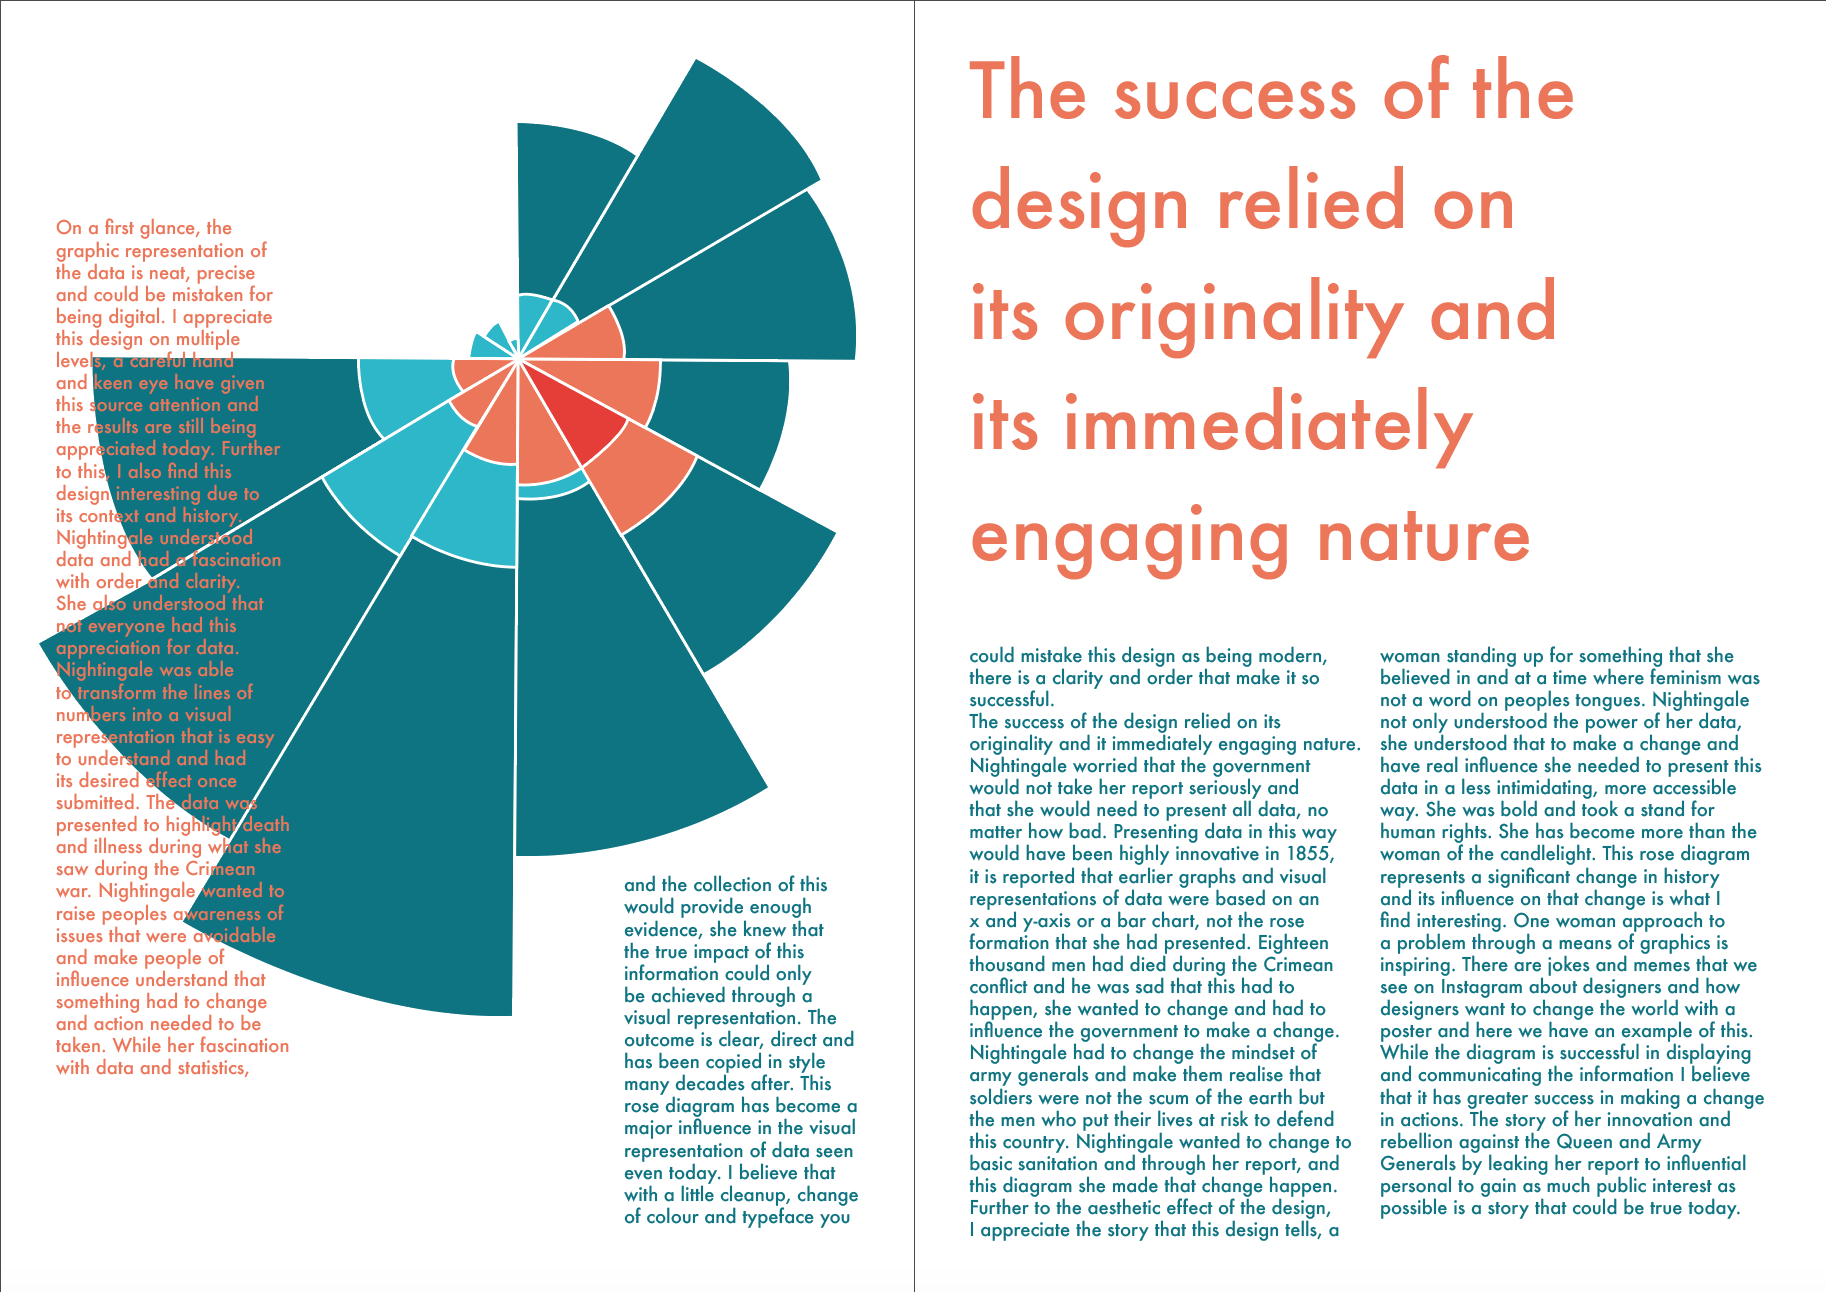
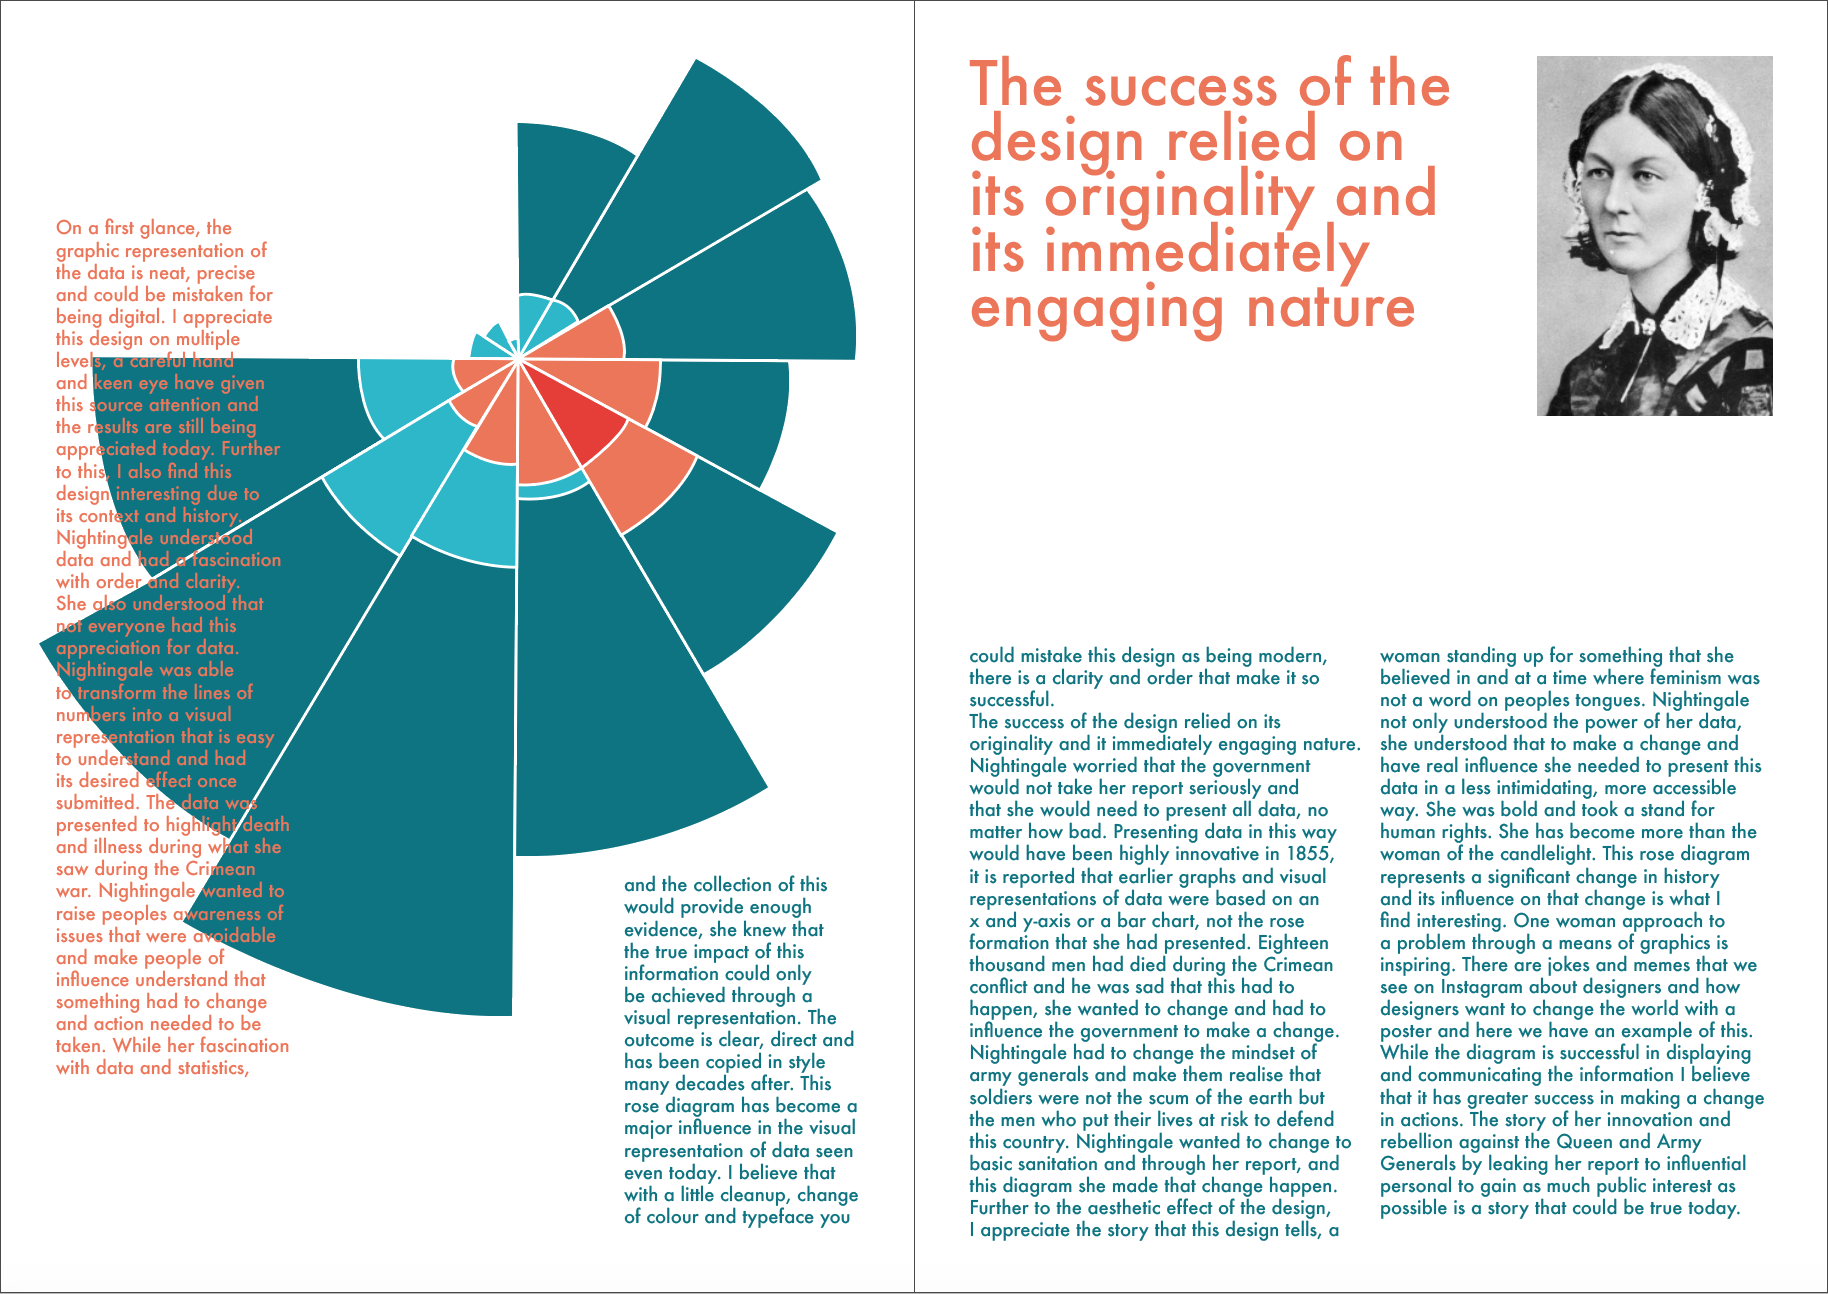
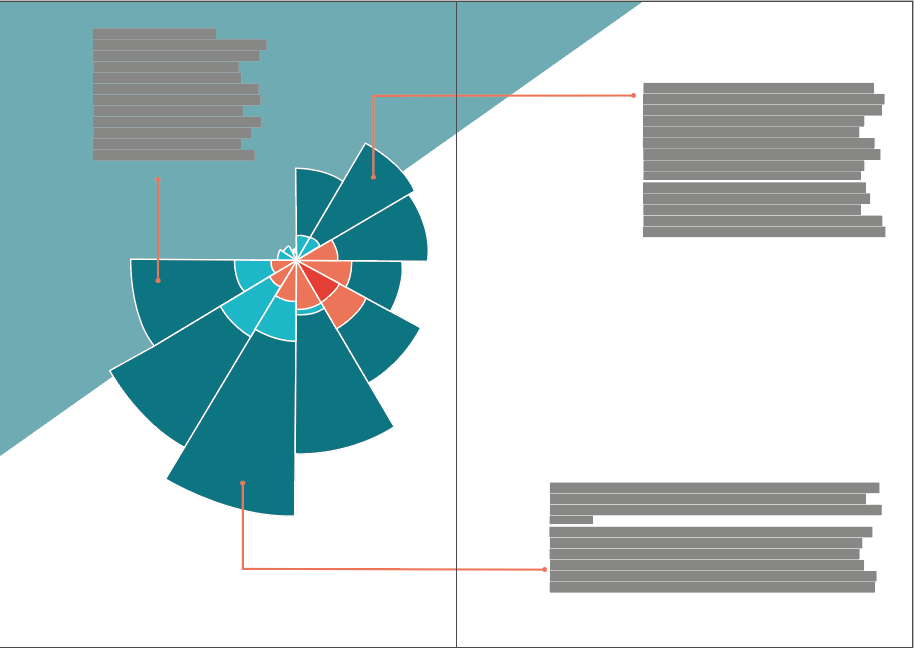
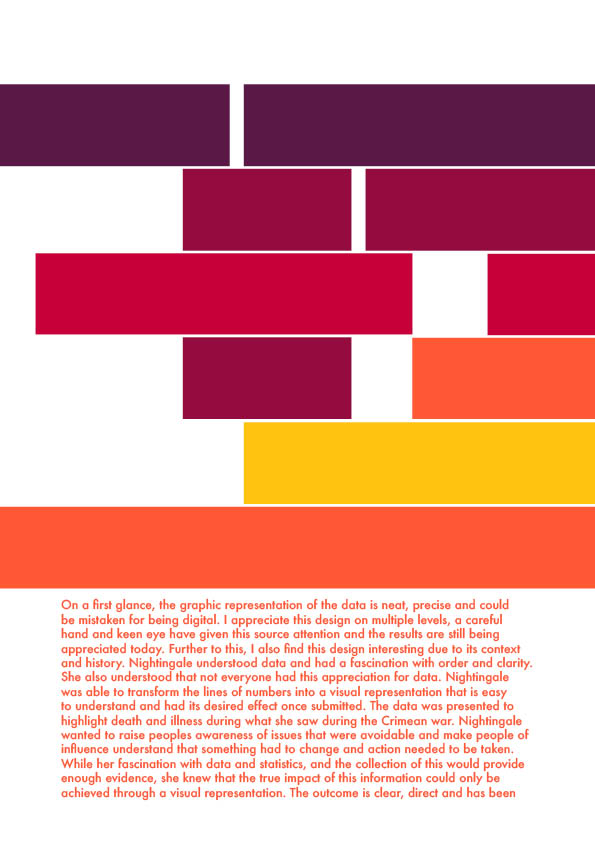
On a first glance, the graphic representation of the data is neat, precise and could be mistaken for being digital. I appreciate this design on multiple levels, a careful hand and keen eye have given this source attention and the results are still being appreciated today. Further to this, I also find this design interesting due to its context and history. Nightingale understood data and had a fascination with order and clarity. She also understood that not everyone had this appreciation for data. Nightingale was able to transform the lines of numbers into a visual representation that is easy to understand and had its desired effect once submitted. The data was presented to highlight death and illness during what she saw during the Crimean war. Nightingale wanted to raise peoples awareness of issues that were avoidable and make people of influence understand that something had to change and action needed to be taken. While her fascination with data and statistics, and the collection of this would provide enough evidence, she knew that the true impact of this information could only be achieved through a visual representation. The outcome is clear, direct and has been copied in style many decades after. This rose diagram has become a major influence in the visual representation of data seen even today. I believe that with a little cleanup, change of colour and typeface you could mistake this design as being modern, there is a clarity and order that make it so successful.
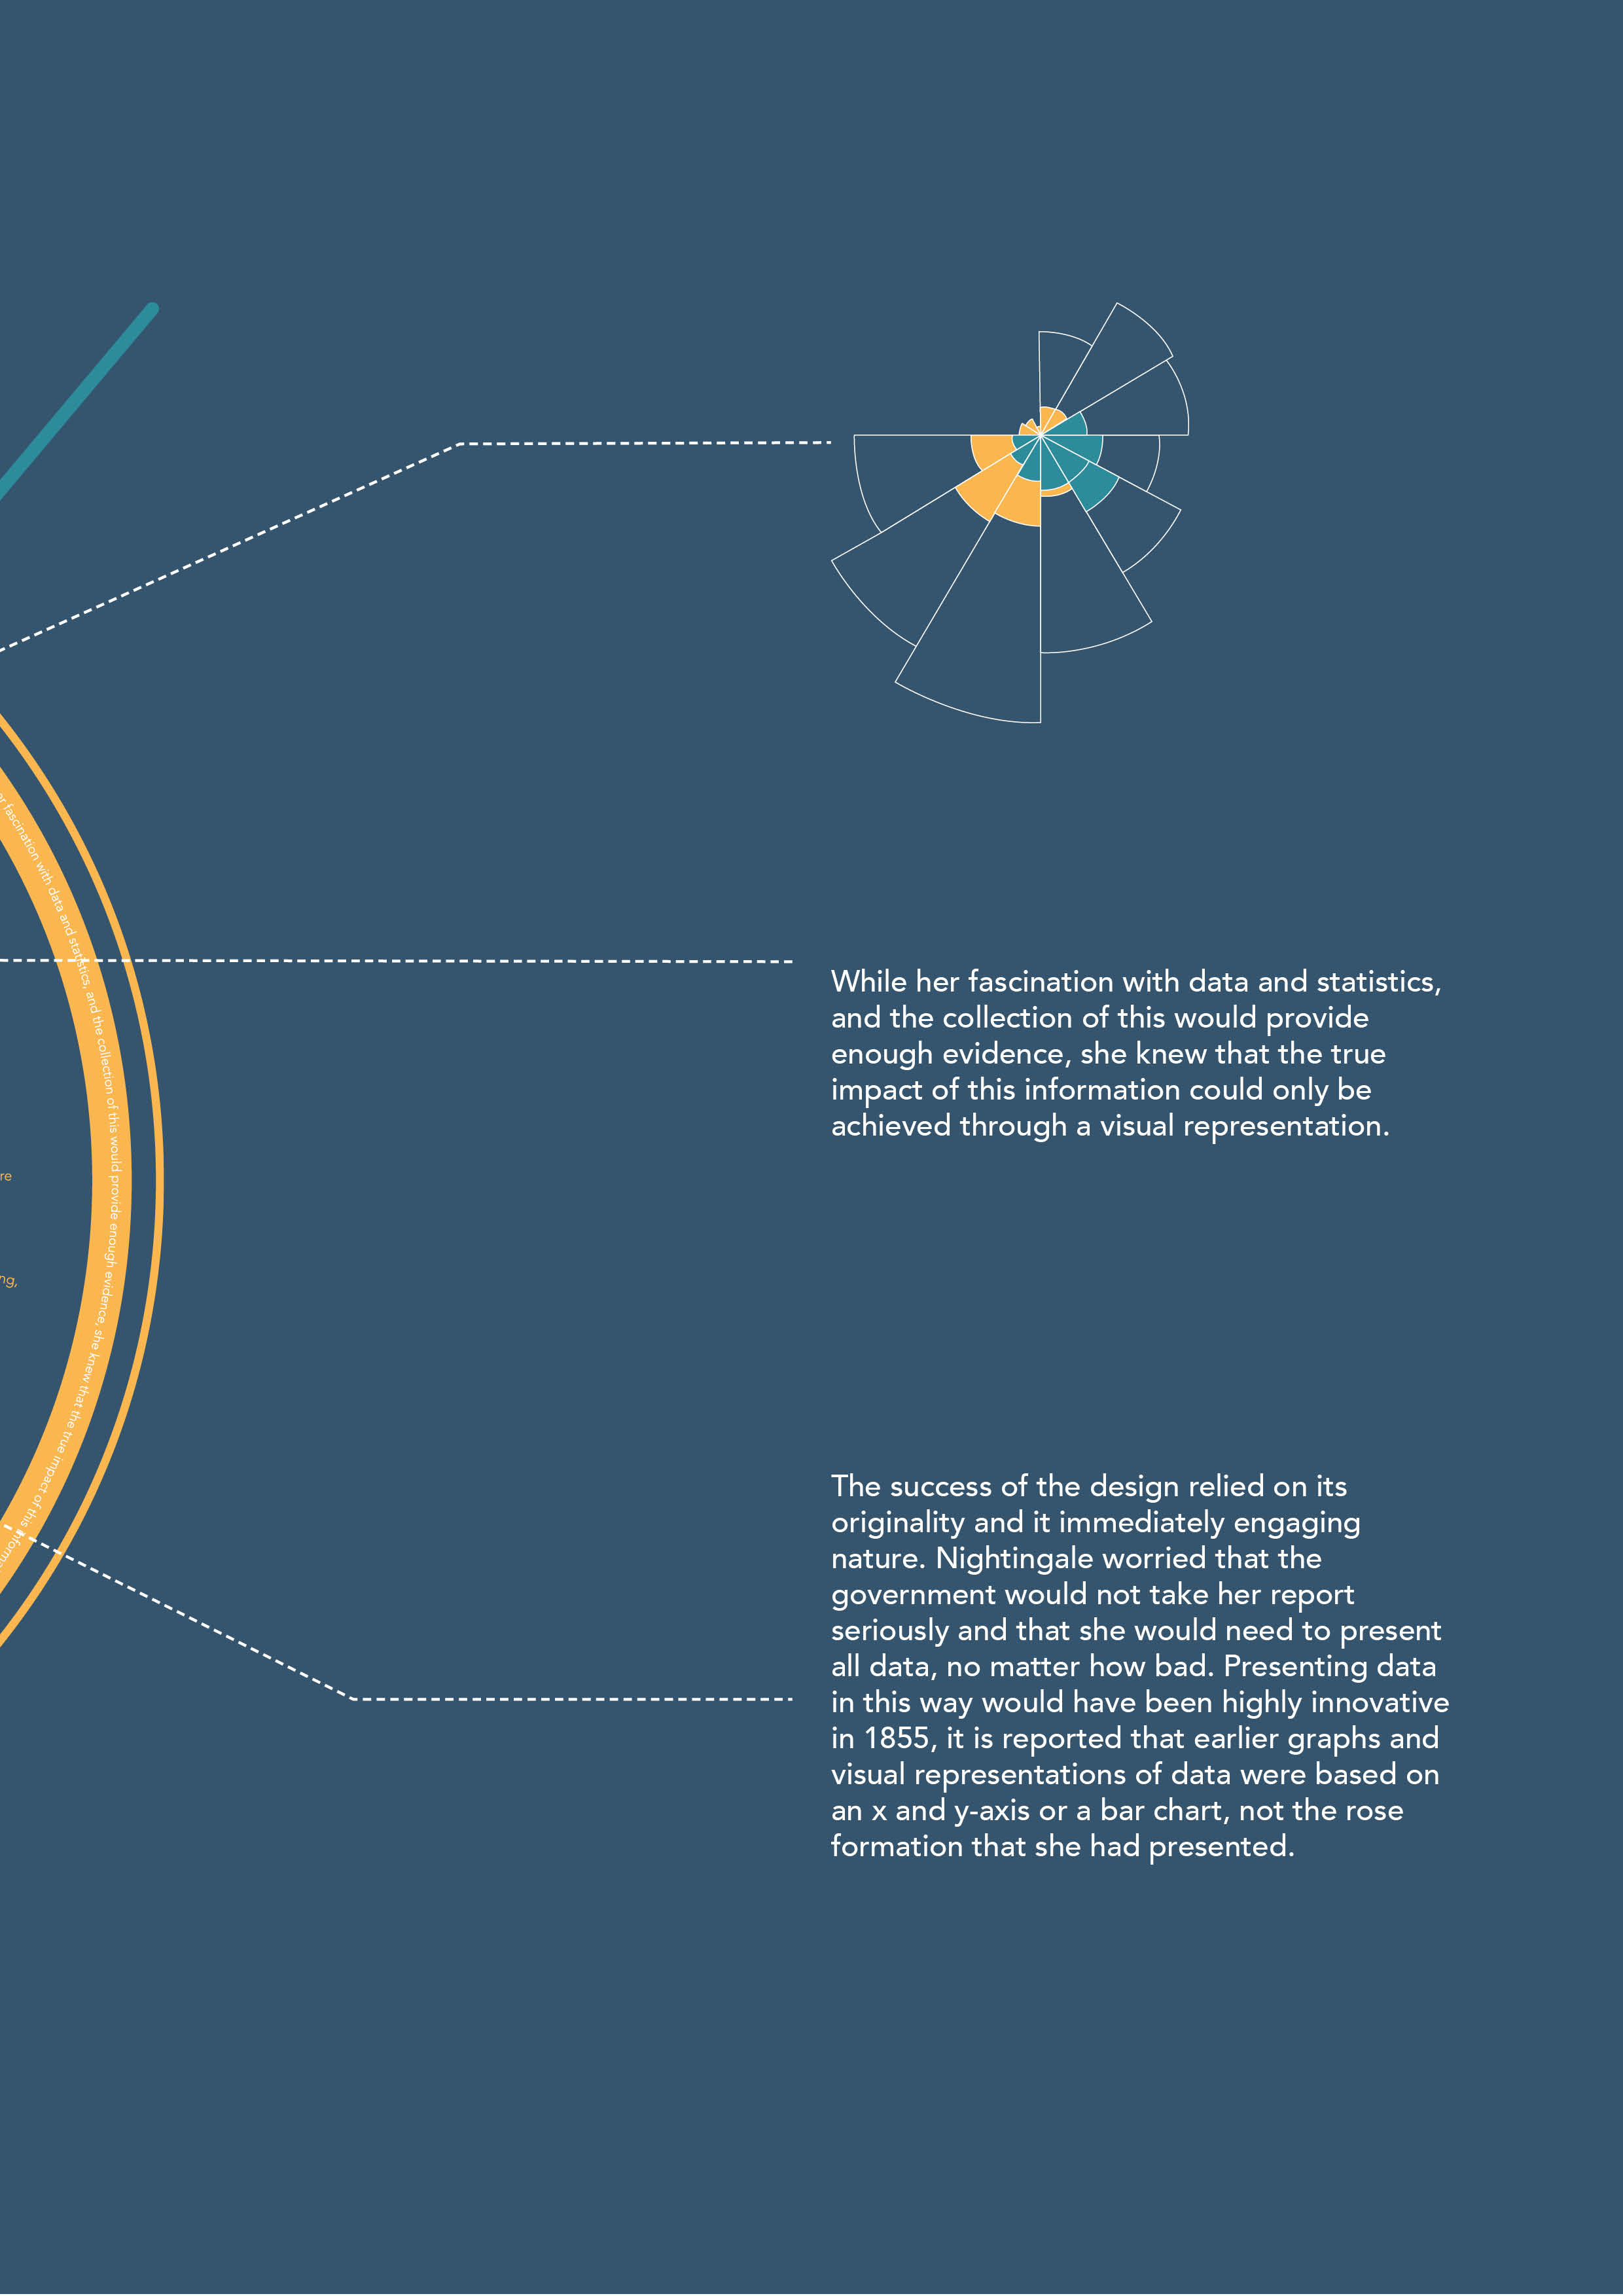
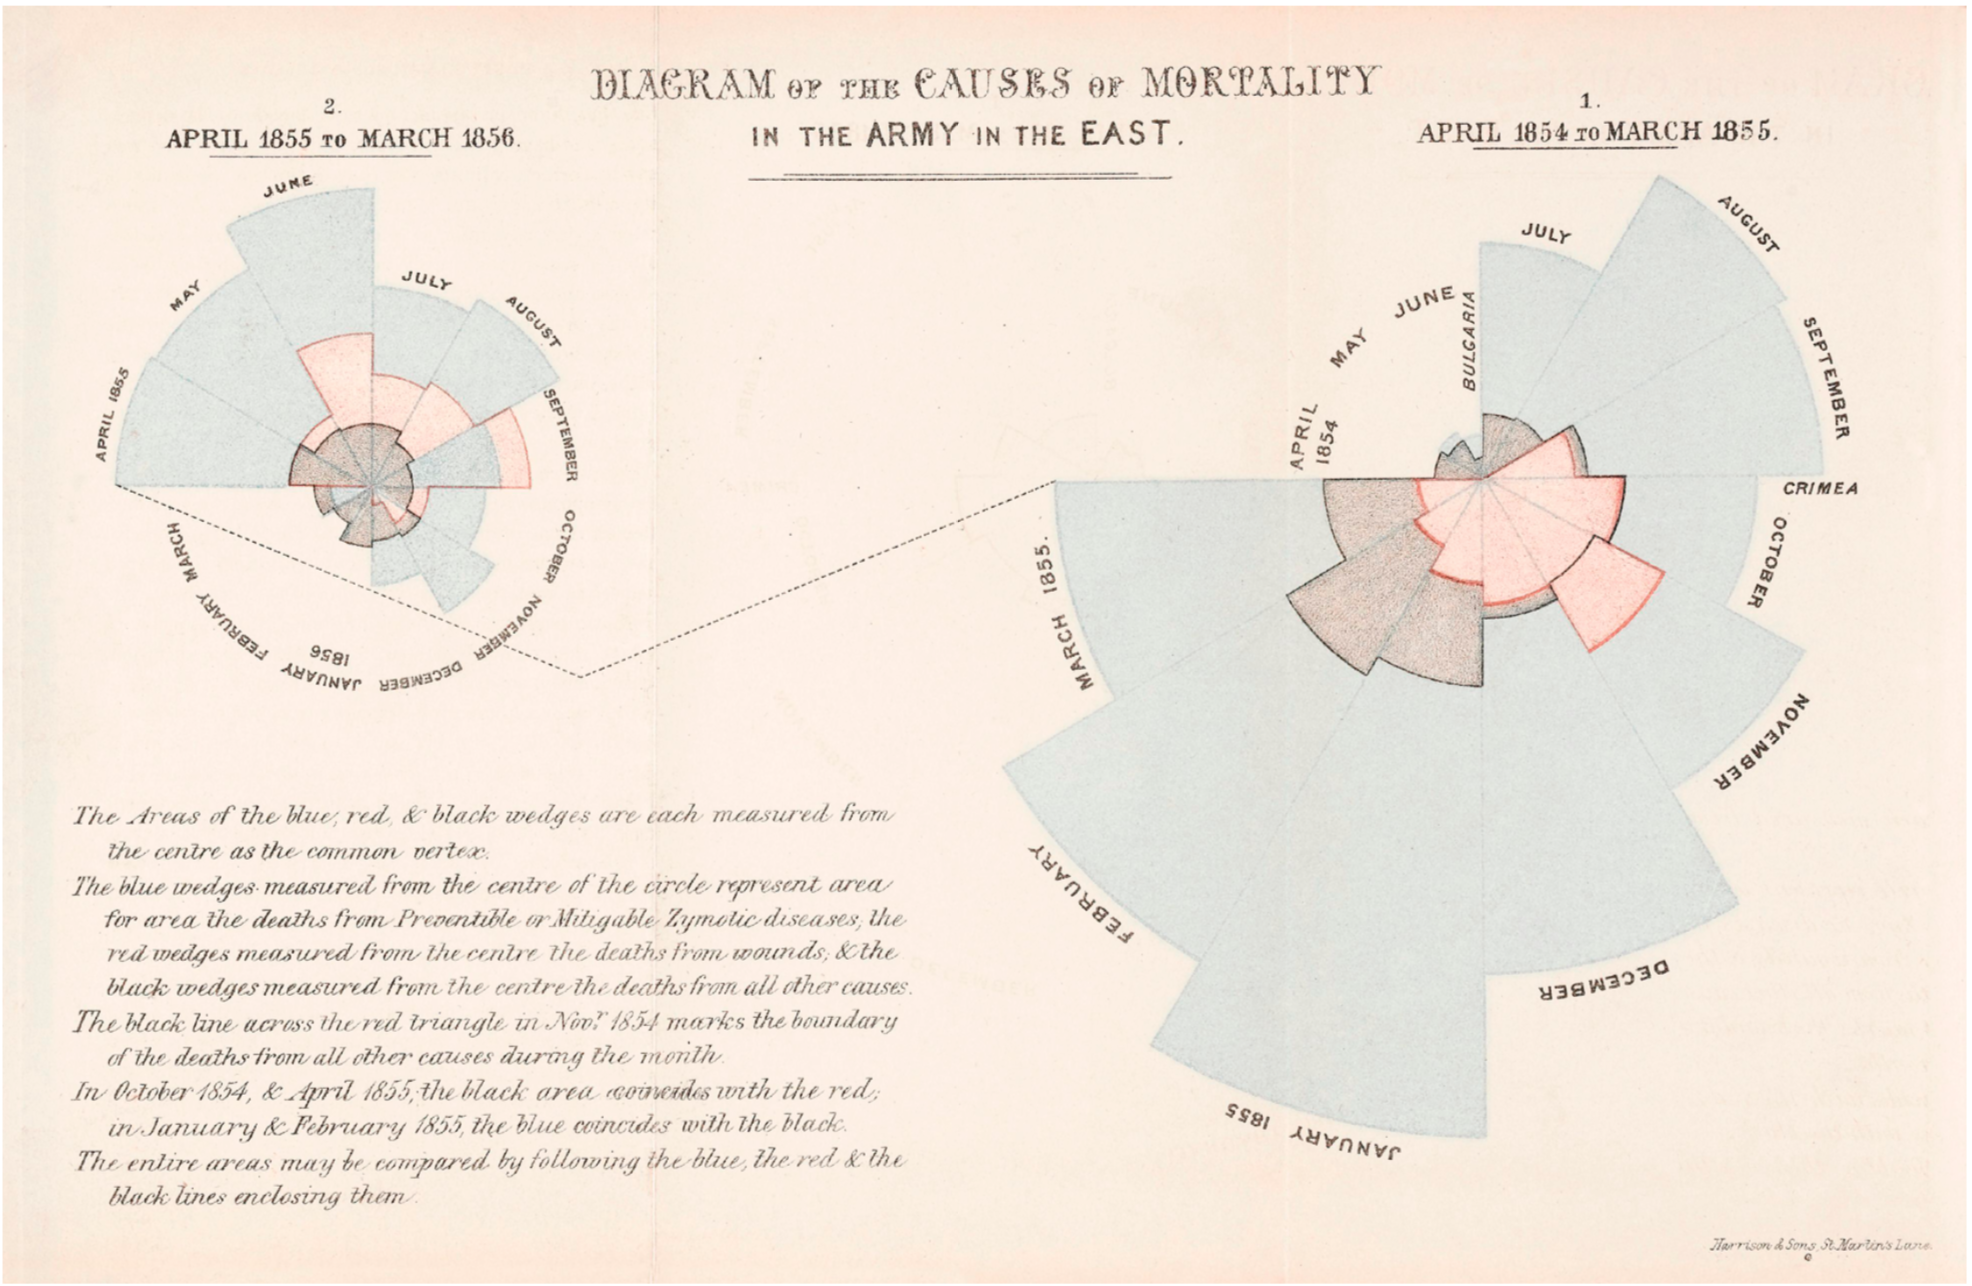
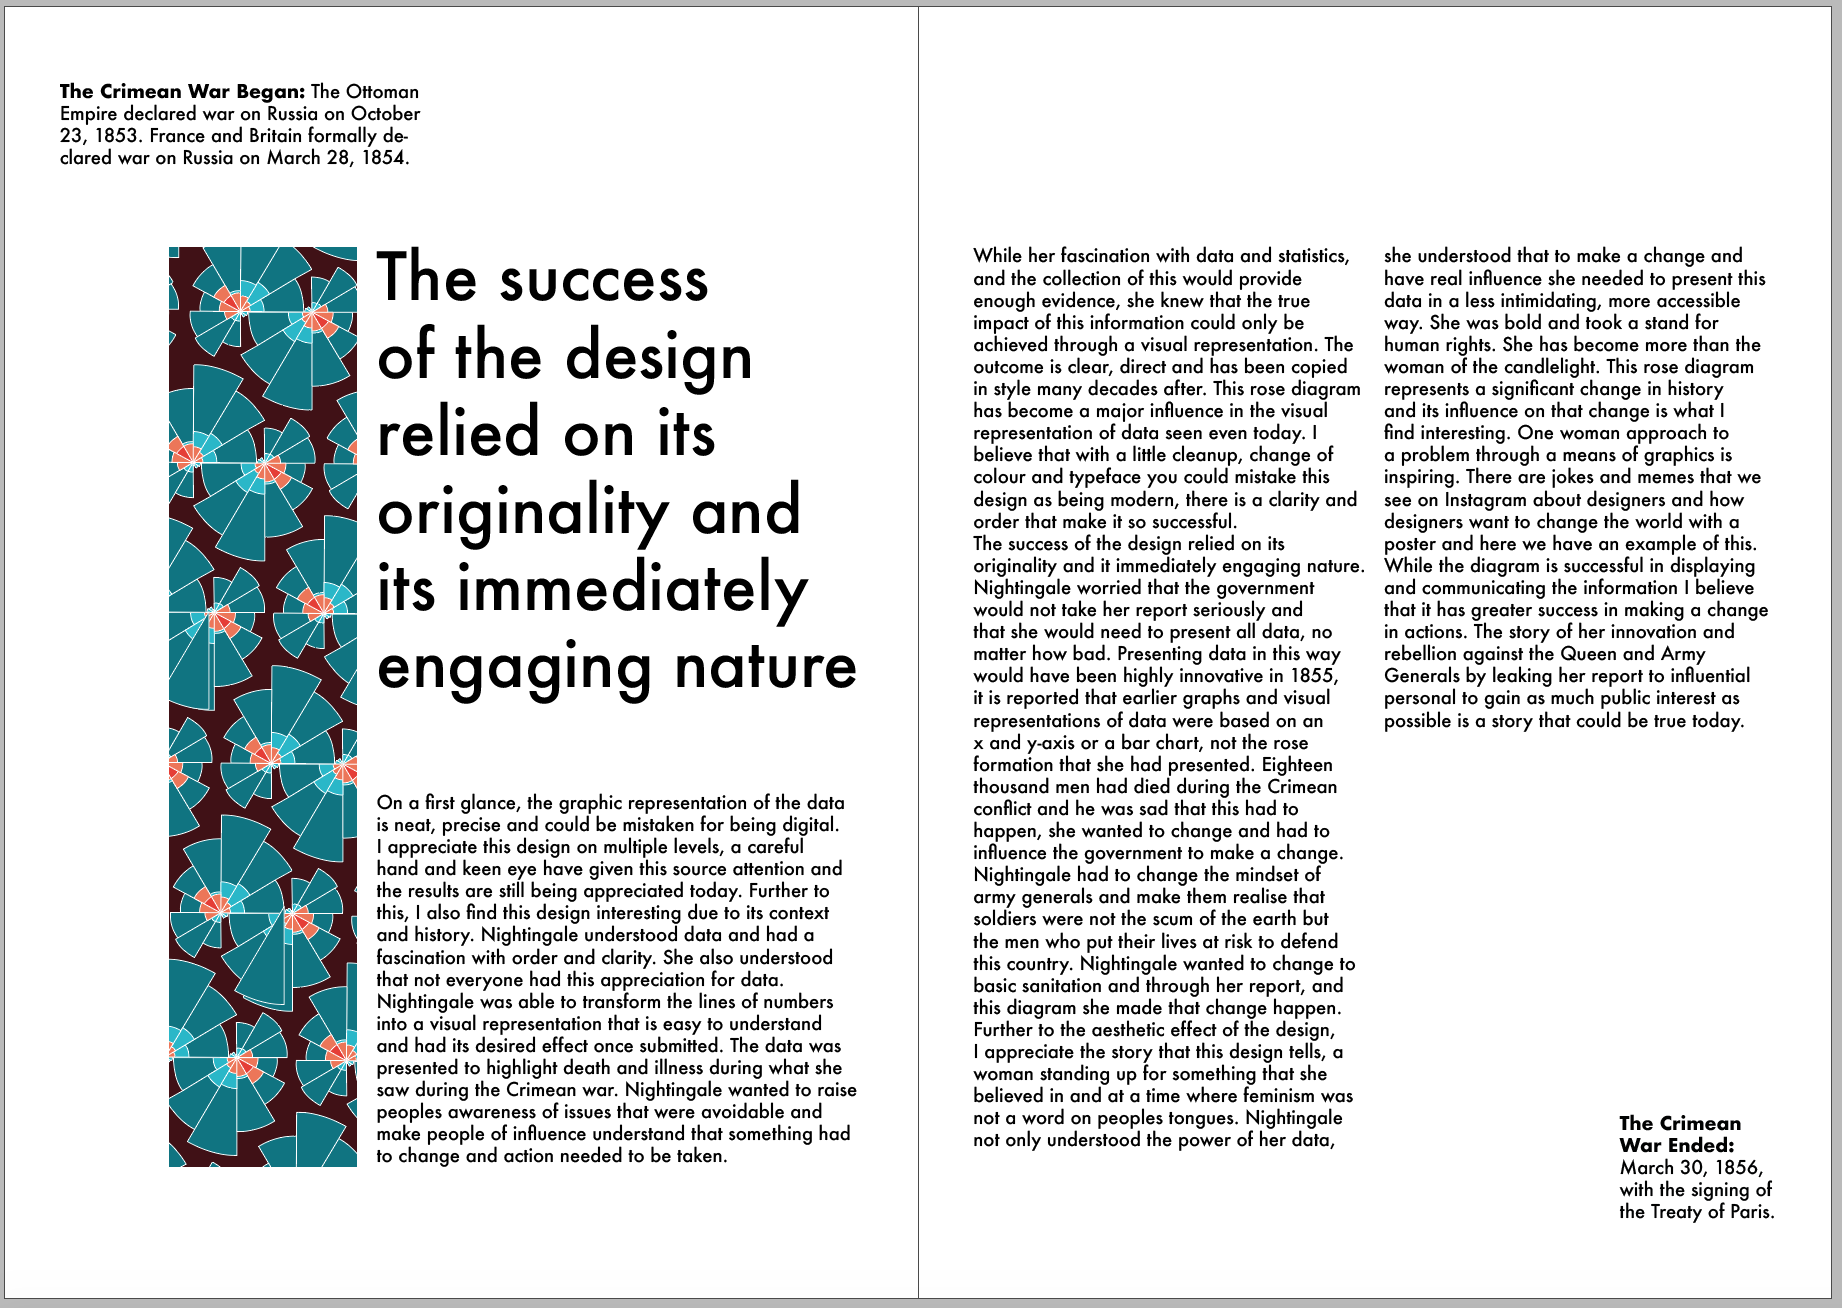
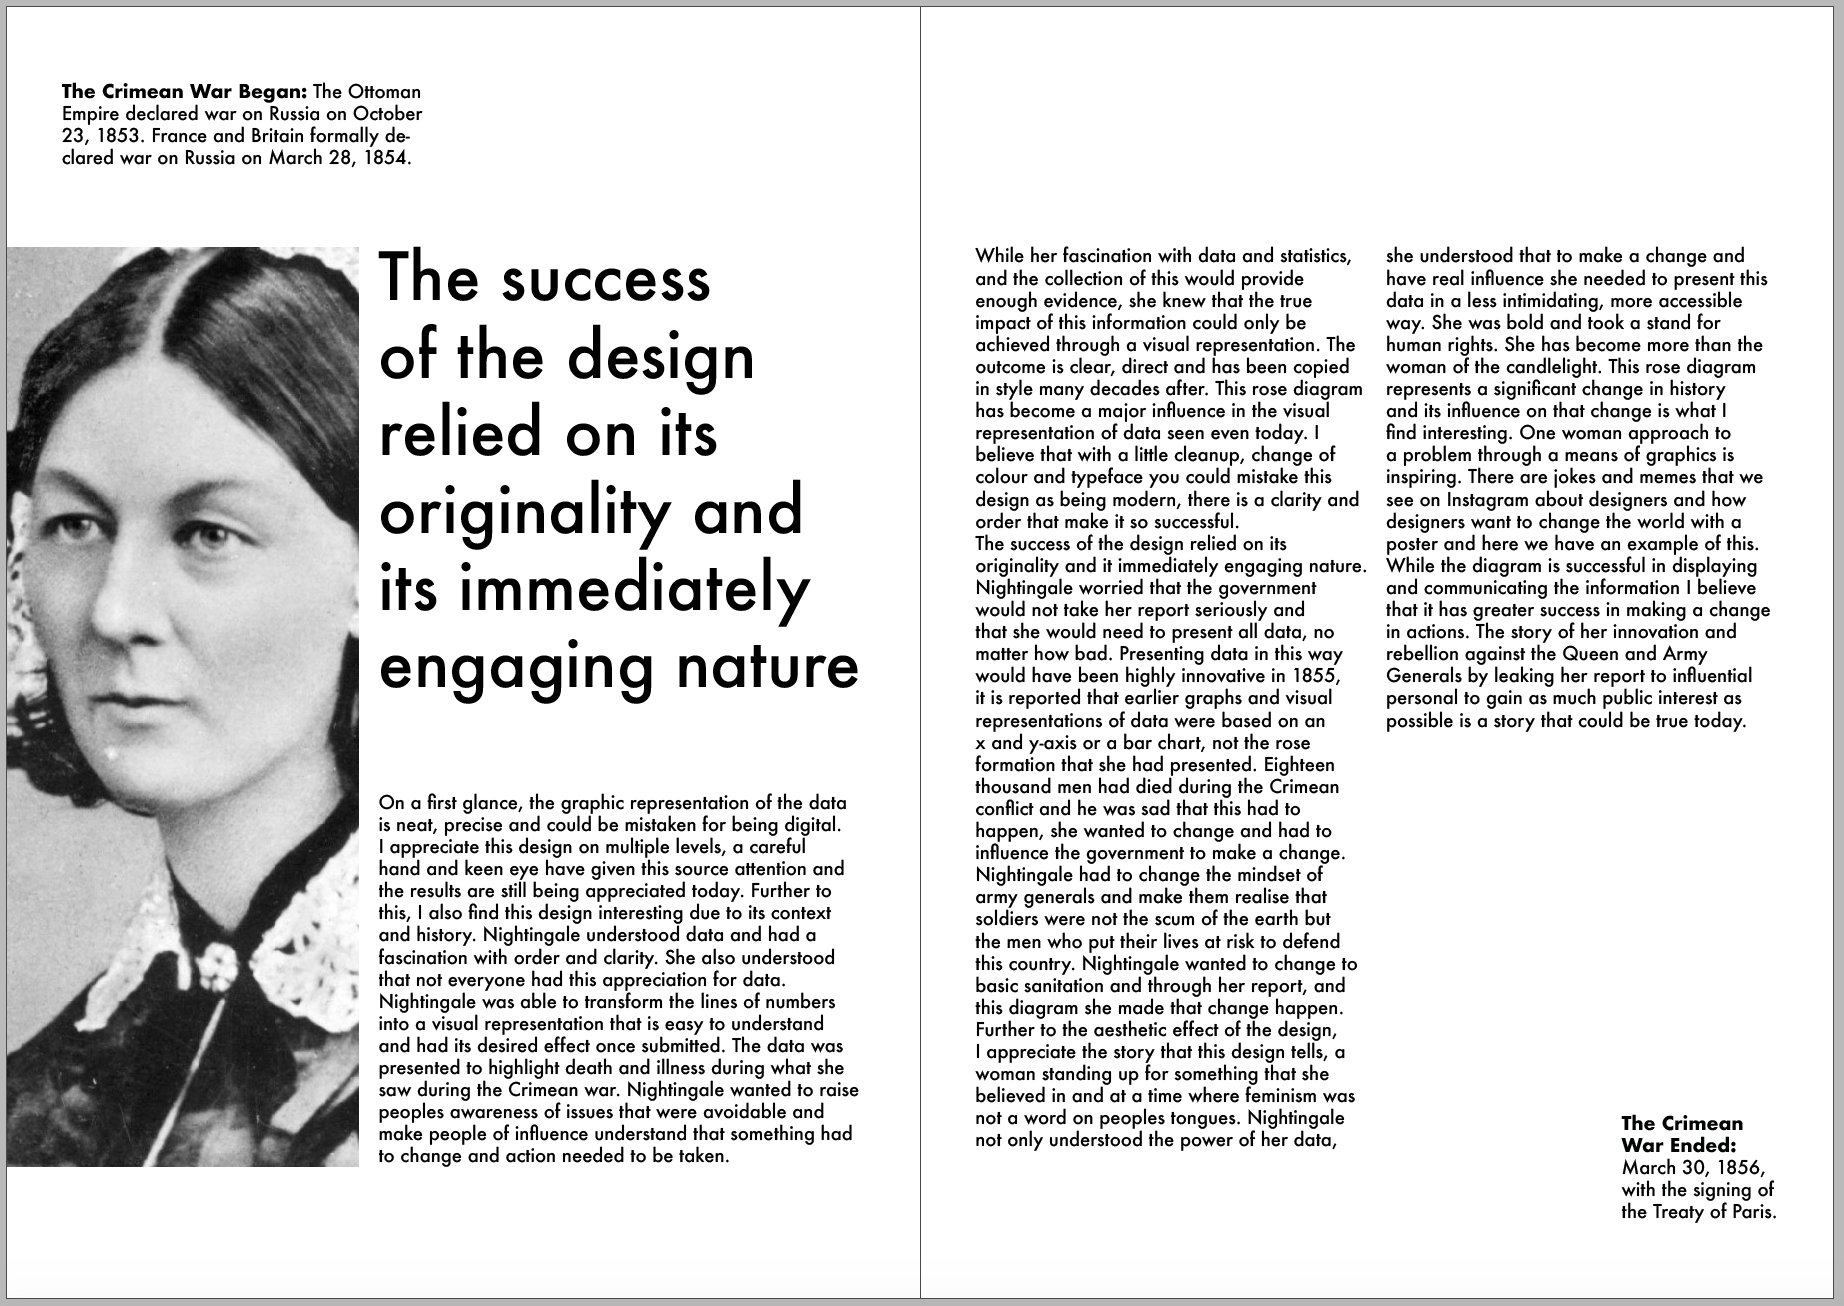
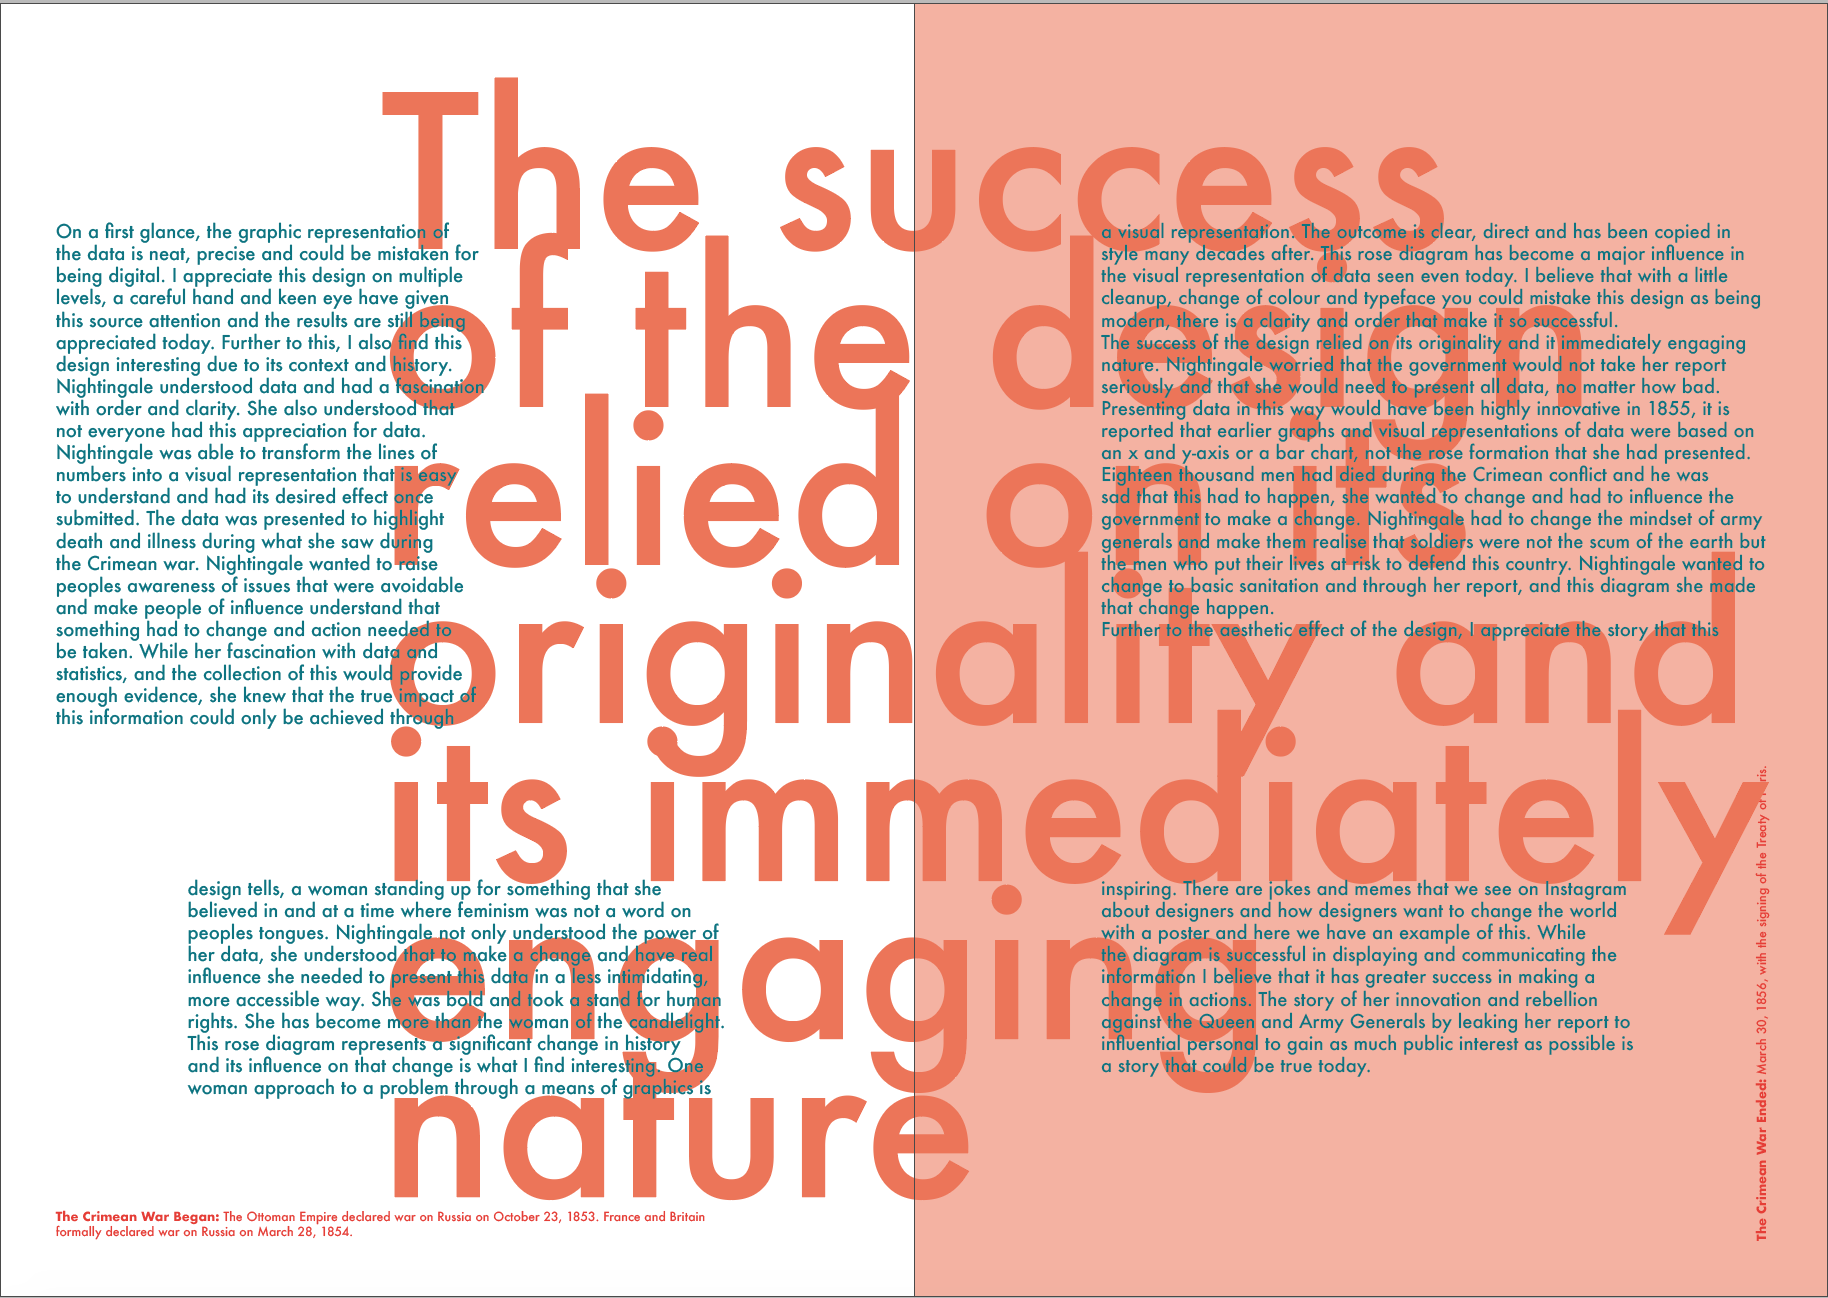
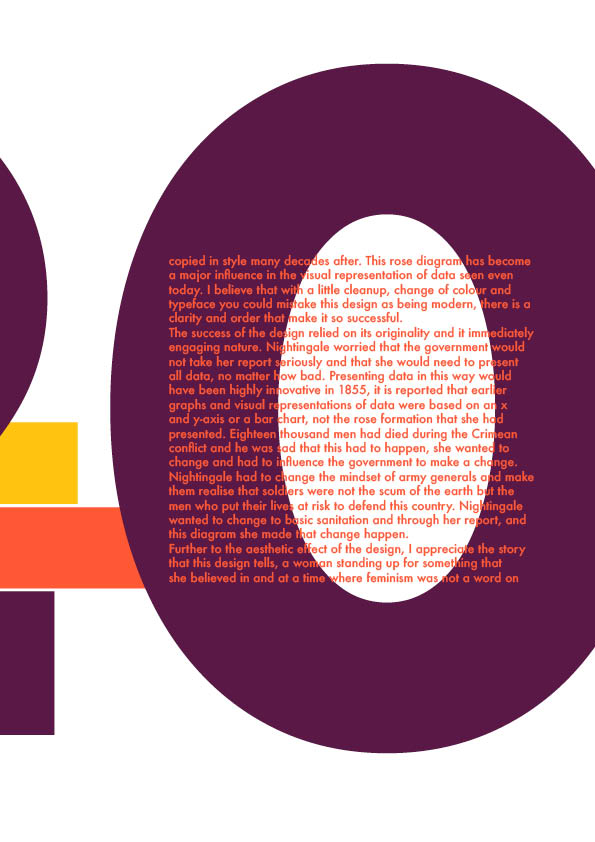
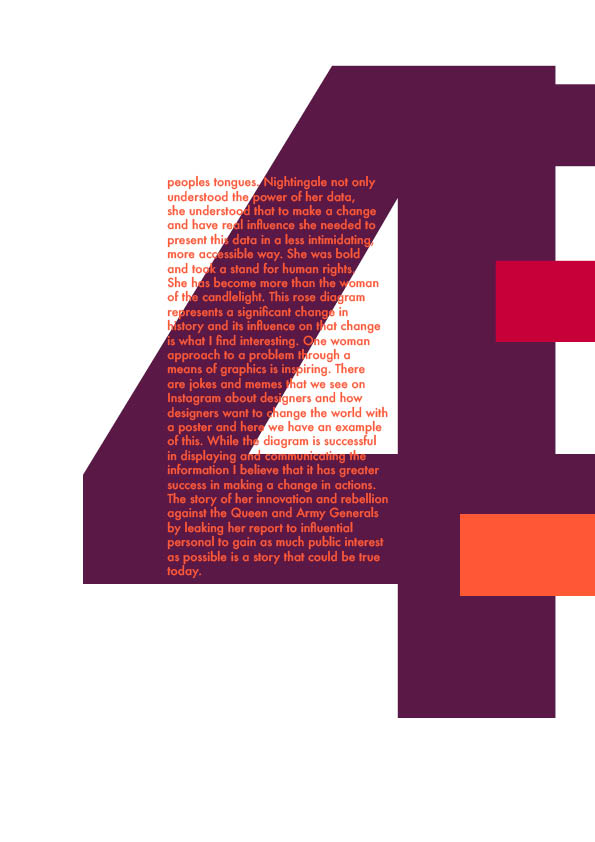
The success of the design relied on its originality and it immediately engaging nature. Nightingale worried that the government would not take her report seriously and that she would need to present all data, no matter how bad. Presenting data in this way would have been highly innovative in 1855, it is reported that earlier graphs and visual representations of data were based on an x and y-axis or a bar chart, not the rose formation that she had presented. Eighteen thousand men had died during the Crimean conflict and he was sad that this had to happen, she wanted to change and had to influence the government to make a change. Nightingale had to change the mindset of army generals and make them realise that soldiers were not the scum of the earth but the men who put their lives at risk to defend this country. Nightingale wanted to change to basic sanitation and through her report, and this diagram she made that change happen.
Further to the aesthetic effect of the design, I appreciate the story that this design tells, a woman standing up for something that she believed in and at a time where feminism was not a word on peoples tongues. Nightingale not only understood the power of her data, she understood that to make a change and have real influence she needed to present this data in a less intimidating, more accessible way. She was bold and took a stand for human rights. She has become more than the woman of the candlelight. This rose diagram represents a significant change in history and its influence on that change is what I find interesting. One woman approach to a problem through a means of graphics is inspiring. There are jokes and memes that we see on Instagram about designers and how designers want to change the world with a poster and here we have an example of this. While the diagram is successful in displaying and communicating the information I believe that it has greater success in making a change in actions. The story of her innovation and rebellion against the Queen and Army Generals by leaking her report to influential personal to gain as much public interest as possible is a story that could be true today.
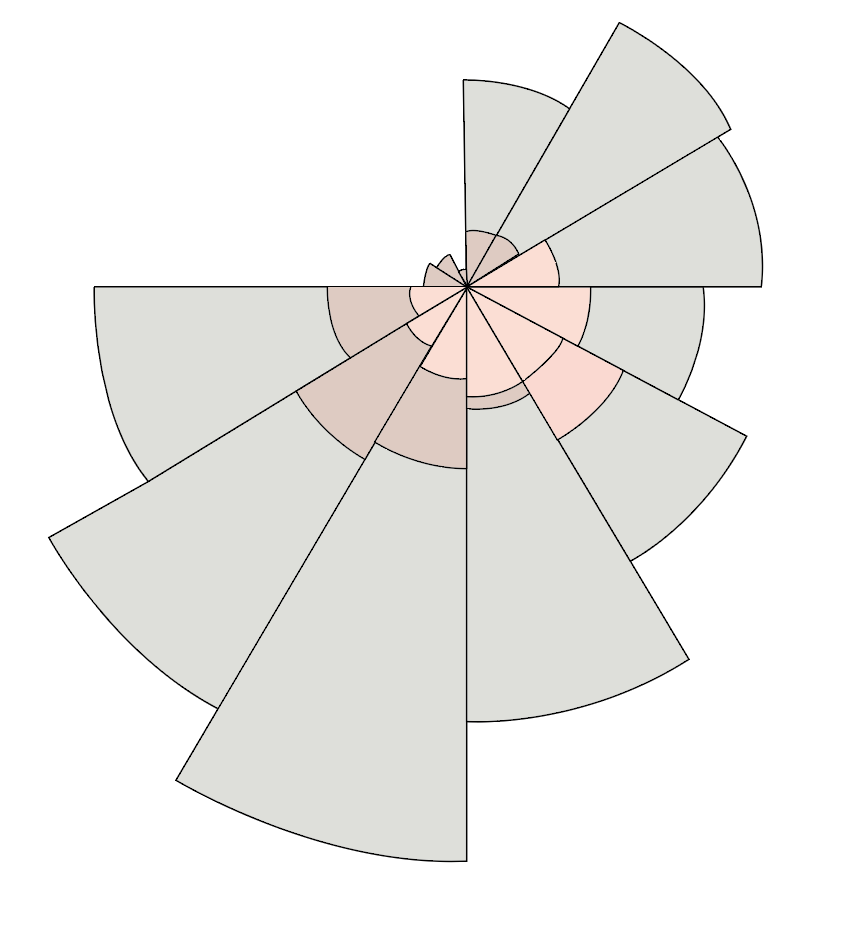
My challenge now is to transform my analysis and awe for this design into something that does justice to such an incredible woman. I first started to trace and copy the design to get under the skin of it and try to find patterns or some understanding of the aesthetics. While at first, I did not notice anything that was screaming out to me as an idea for this weeks challenge, I did reflect on the precise nature of the graph and that each line and curve is all accurately measured. I then wondered with no numbers, how would people know the statistics, I conceded that this was not the point of the graphic but it did raise a question of how did Nightingale decide line length and relative depth of each strand.

From this, I began to reflect on this graph as a shape, something that could be transformed into a pattern, or an icon that could be used as a detail within the design. I started to sketch out ideas and think about how I could construct this editorial design. Thoughts about using numbers or representations of numbers/statistics in the design to create an impact of the realities of what happened. I began to think about how the report would be designed today, would the NHS commission such a report and how would that be presented. I felt that I needed to create some rules or parameters to this design and work within this. This would allow me to be creative and stretch the idea within tight confines of a concept, an approach that I have enjoyed in previous weeks more so with the type.
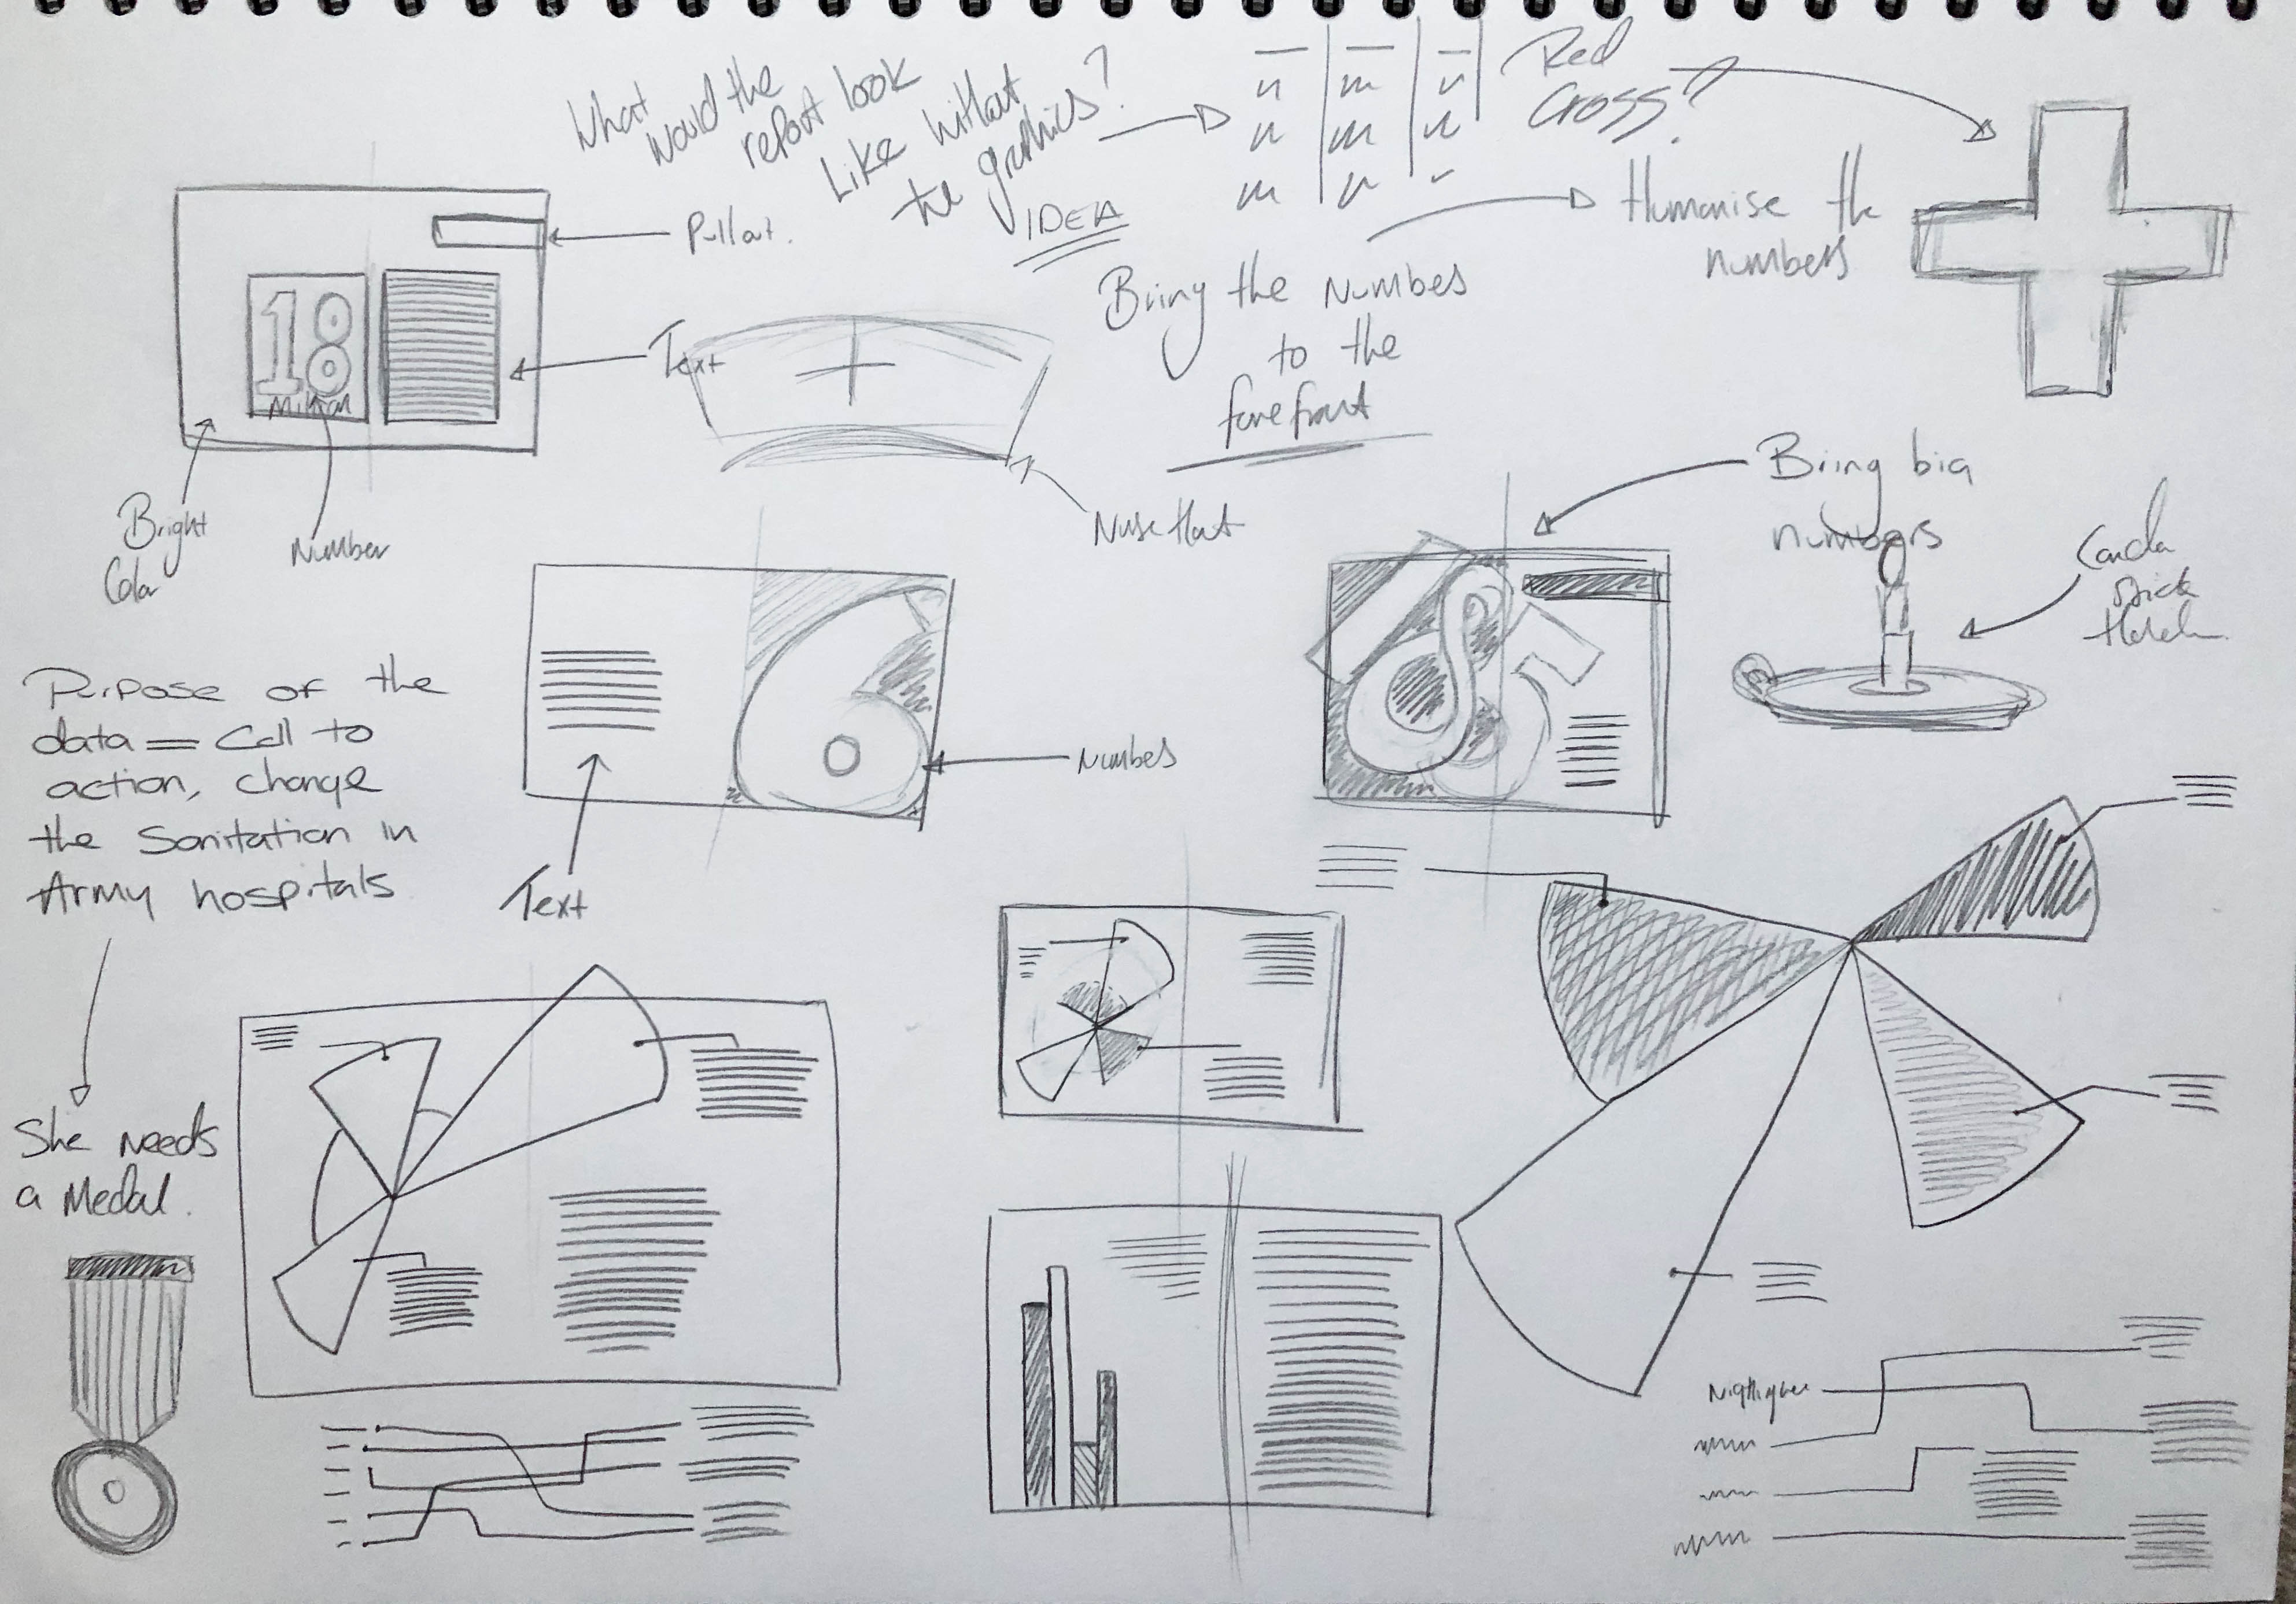
I started to sketch out some ideas and concepts for the layout, with some degree of interesting ideas. I wanted to incorporate numbers as I felt that this was missing from the original diagram. I had thought about creating something that used the number of words, or how many times I had used words to create a rhythm or rule to the works but this did not materialise. Even on my digital experiments, I had neglected the idea of using numbers in this way. I focused on the layout and composition of a headline type, body copy and an image. Below are a series of layout options and variations/experiments. Editorial design is something that I like the idea of, again creating rules and structure but I never seem to be able to settle on a certain idea or even generate something that has an individuality. I guess this is due to my process of just using the screen and hoping for something to pop out when each one looks the same as every other design on Pinterest or Behance. From these ideas, I need to create a rule or some parameters to my work and try to explore options within this. Do I need to print out the type and explore an idea with my hands then incorporate some digital element? Yes probably.


These digital experiments still do not fill me with excitement or real interest, while I had set up some parameters of gudies and grids, type and colour I still felt that they were not as engaging as i would like. I will continue to experiment with this and I hope that a 1-1 with stuart will spark some ideas of where I can go with this. I had tried to spead the information across three pages as if it were a magazine, I looks like a boring fact sheet, a simple and not very interesting report. I need to find a way of working that engages me more and results in more interesting outcomes.
With the deadline looming I am concerned that at this point I have not yet found a pattern or system with this project, as much as I have enjoyed the research and found the story fascinating I am still unsure how I will transcend these ideas into a visual form. But I will keep going and see what happens. I think I will try to use David McCandless as an inspiration for further experiments, his use of geometric shapes to represent data in ways that do not entirely demonstrate the data itself. His use of colours and a hierarchy of information could be something that I hold onto, his work demonstrates influence to the numbers but like Nightingale does not always show this in the visualisation. I will aim to develop a visualisation that incorporates the set type.


Here I tried to create a pattern, something that could dictate the page and hopefully have an impact. The numbers are there to represent the key data, the body copy isn’t strong on these examples and the main focus is the numbers and the colour. I am still exploring options and feel that I have some work to do in order to get this one to a point where I am completely happy with it. On reflection so far on this weeks workshop challenge, I have gained a broader understanding of the impact of that visualisation can have. I have also thought about the similarities between the story of Florance Nightingale and that of politicians and people wanting to make a change in the world. The power of people to make a change in this world is not a new concept but one that reiterates through history. I endeavour to continue with this and aim to present a solution that is creative, exciting and in some ways innovative.
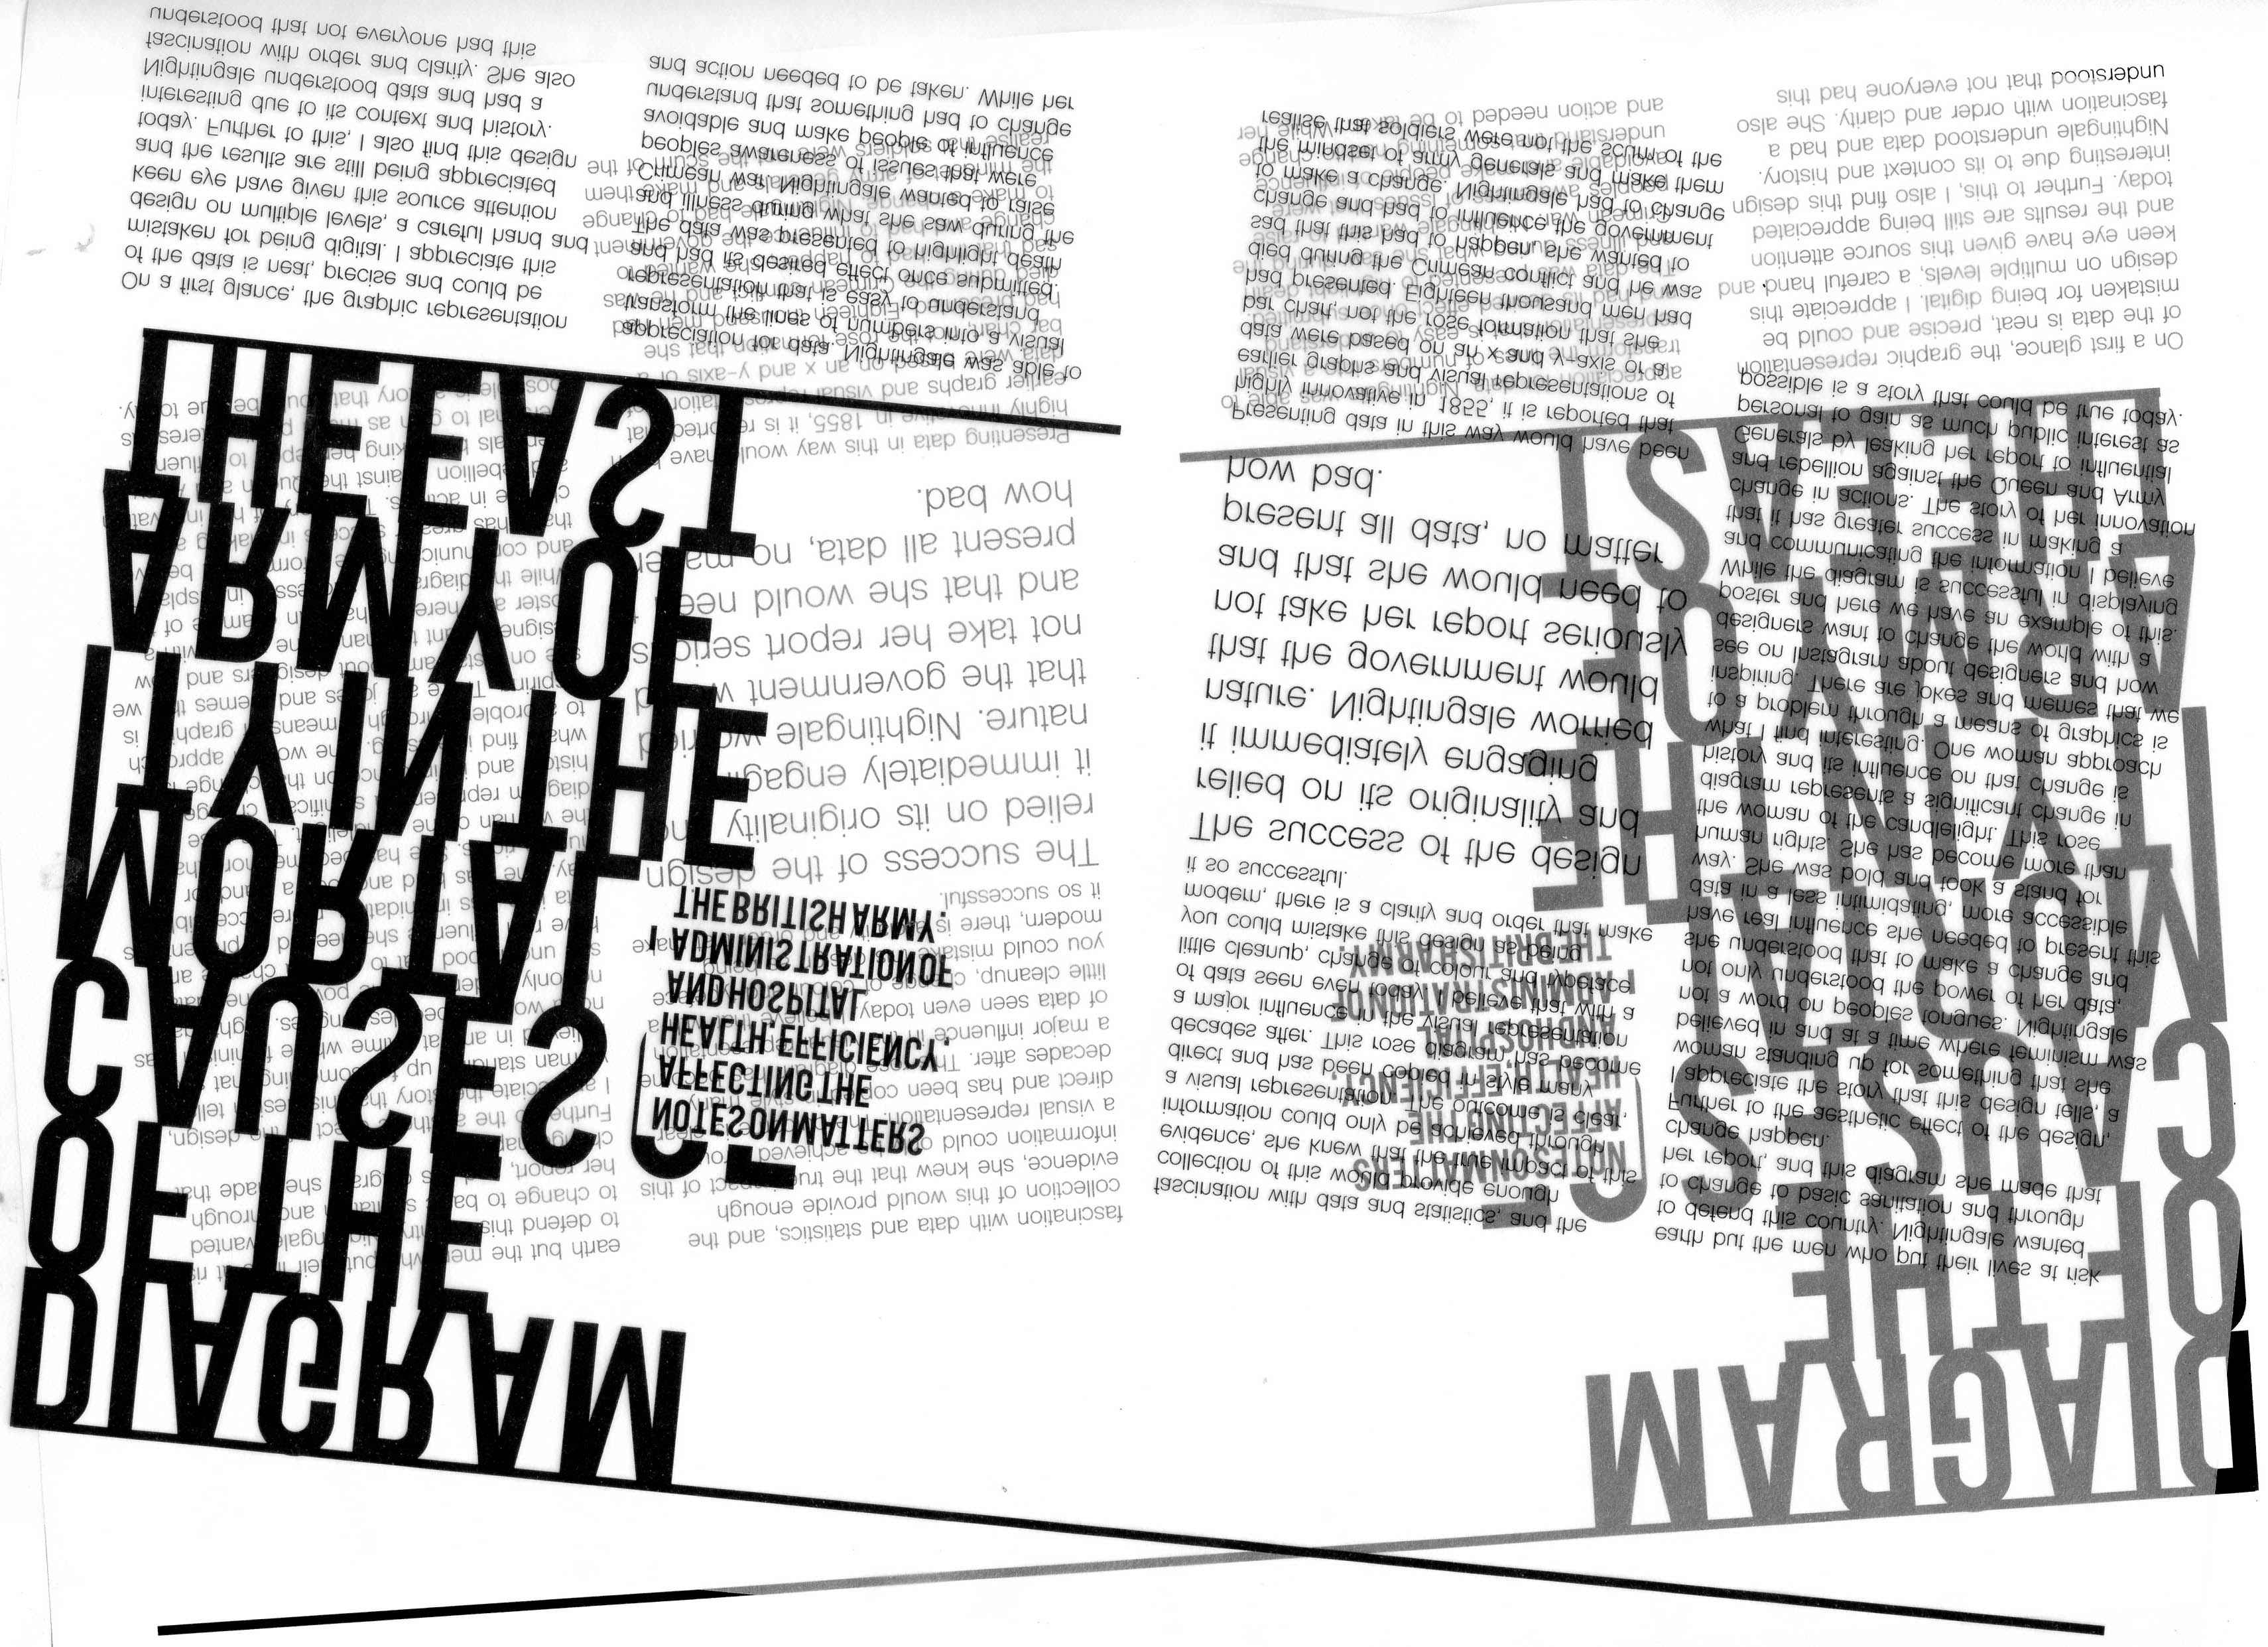
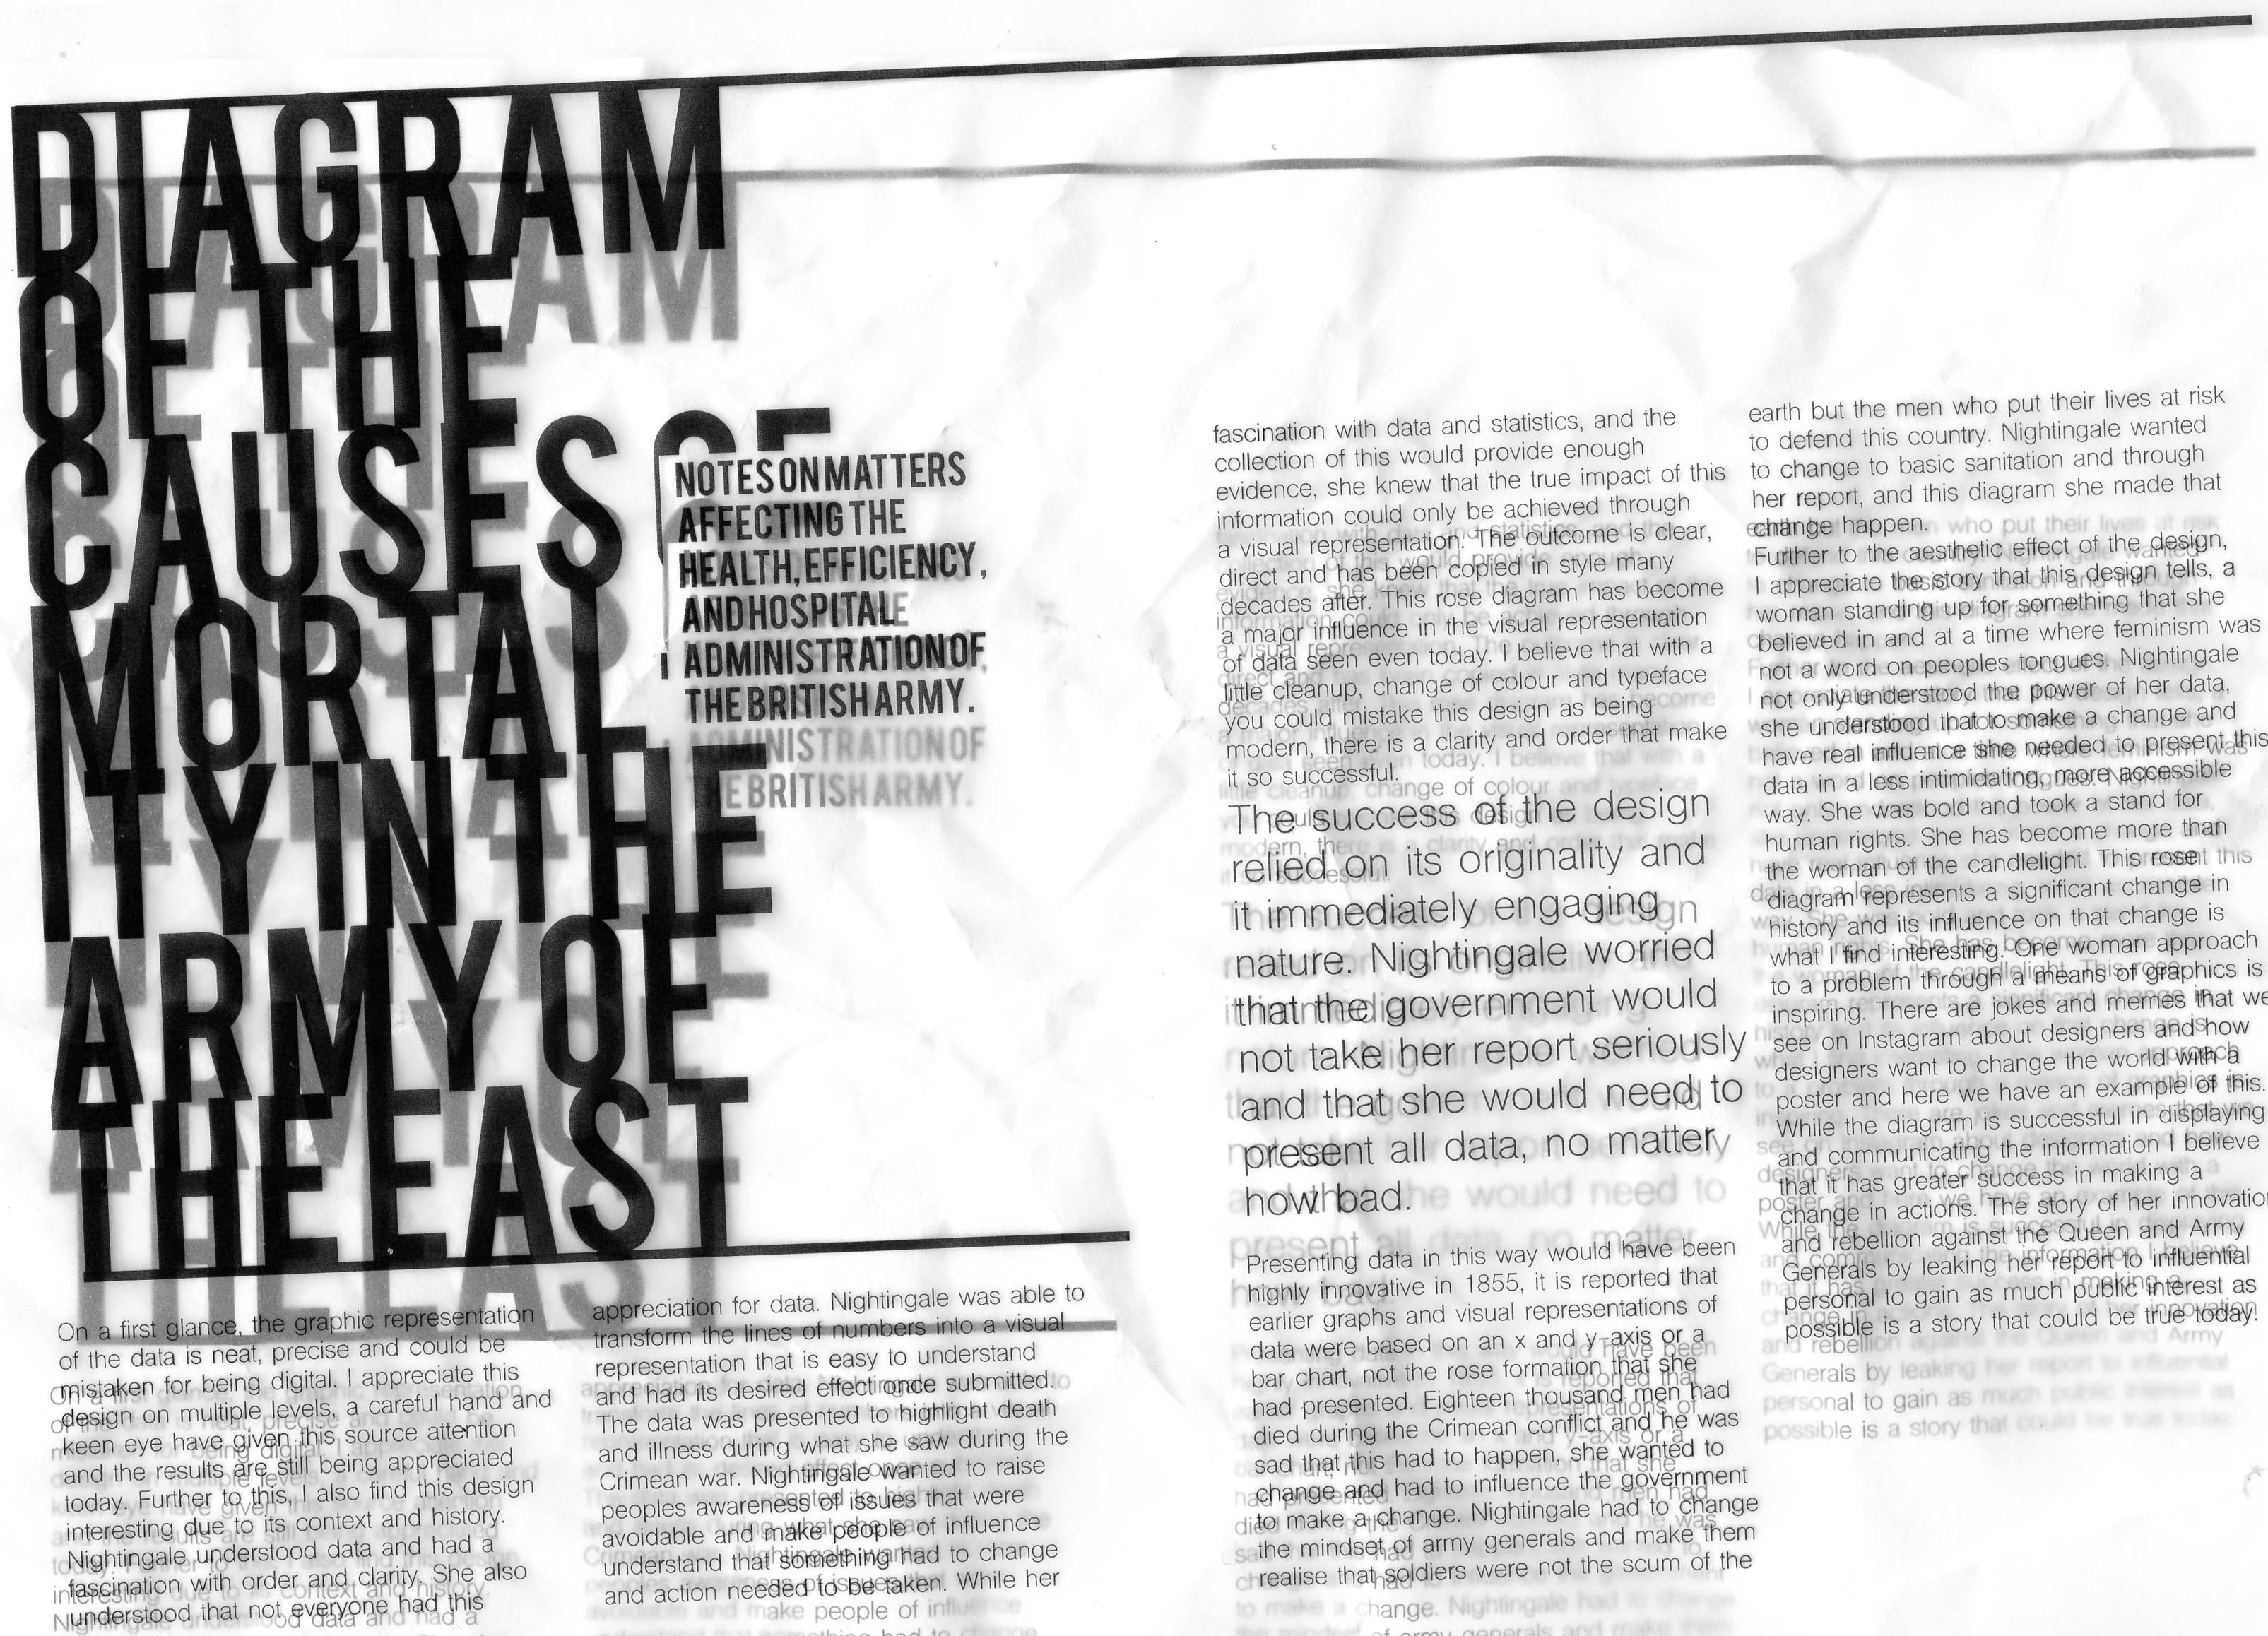
After having a break and a slight meltdown about how I would approach this weeks task I decided to work with what I know and what appears to be coming to a system of working. I’m never happy with the clean simple lines of things digital it’s just that, too clean and digital. for me, it struggles to give real empathy to the story and I needed to show some kind of emotion that must have occurred at the time. I think that the obvious choice would be the frustration of Florance Nightingale or even the anger and frustration of the people it took to make a significant change. I looked at this from the perspective of the Queen or even the Army who would not wish their name to be in dispute. It looks for Nightingale to leek the papers to people of influence and the masses, what would have been in the offices of the Army generals who did not wish for this information to be widespread. Scribbles and notes across each page, Change this, add that. The editorial process of a document that would cause controversy. I go back to the parallels in today’s society and ask how far have we truly moved on? Okay, it may have been easier and quicker for Nightingale to publish her findings but even in 1855, she managed this rather effectively. I have therefore used tracing paper to add layers of edit, disruption and panic to a rather simple design. I believe that this adds some empathy to the story and I hope gives an impression of panic.


Returning to something digital I decided to focus on an idea that was more of visualisation of data rather than the traditional editorial design that I had initially thought that this weeks outcome should be. I feel that this design encompasses the ethos of this weeks work and while it is difficult to read in this low-resolution jpeg form, I would like to try some animation to bring this into the realms of digital editorial, maybe even develop it into a spread..